Fig. 12.
Download original image
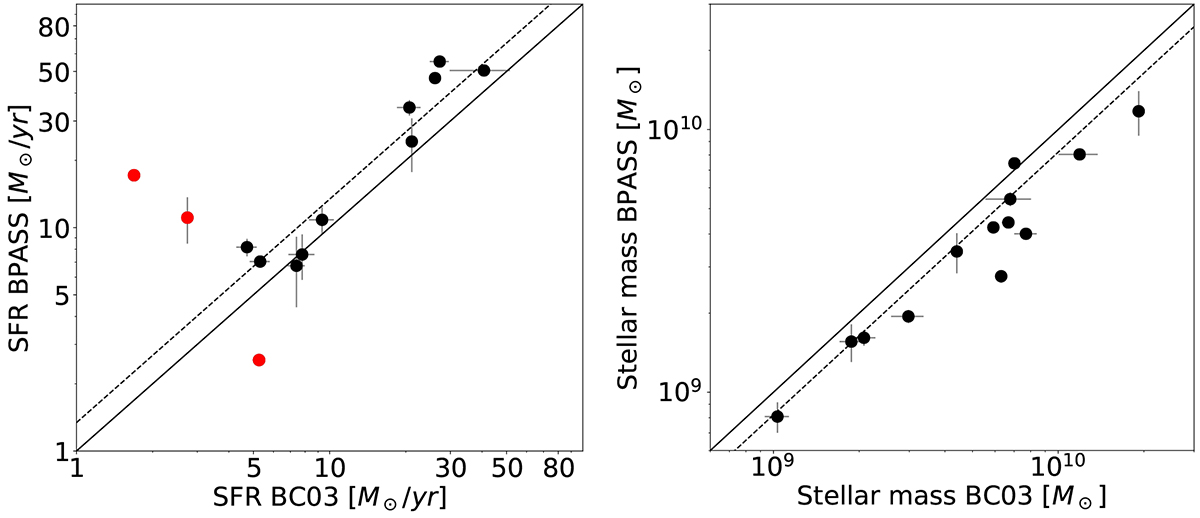
Comparison of the SFR (left panel) and stellar mass (right panel) obtained through fitting spectro-photometric data in a run made with BC03 and a run made with BPASS. The solid line represents the 1:1 relation while the dashed line represents the mean deviation of our sample (without the three outliers in the case of the SFR).
Current usage metrics show cumulative count of Article Views (full-text article views including HTML views, PDF and ePub downloads, according to the available data) and Abstracts Views on Vision4Press platform.
Data correspond to usage on the plateform after 2015. The current usage metrics is available 48-96 hours after online publication and is updated daily on week days.
Initial download of the metrics may take a while.