Fig. 8.
Download original image
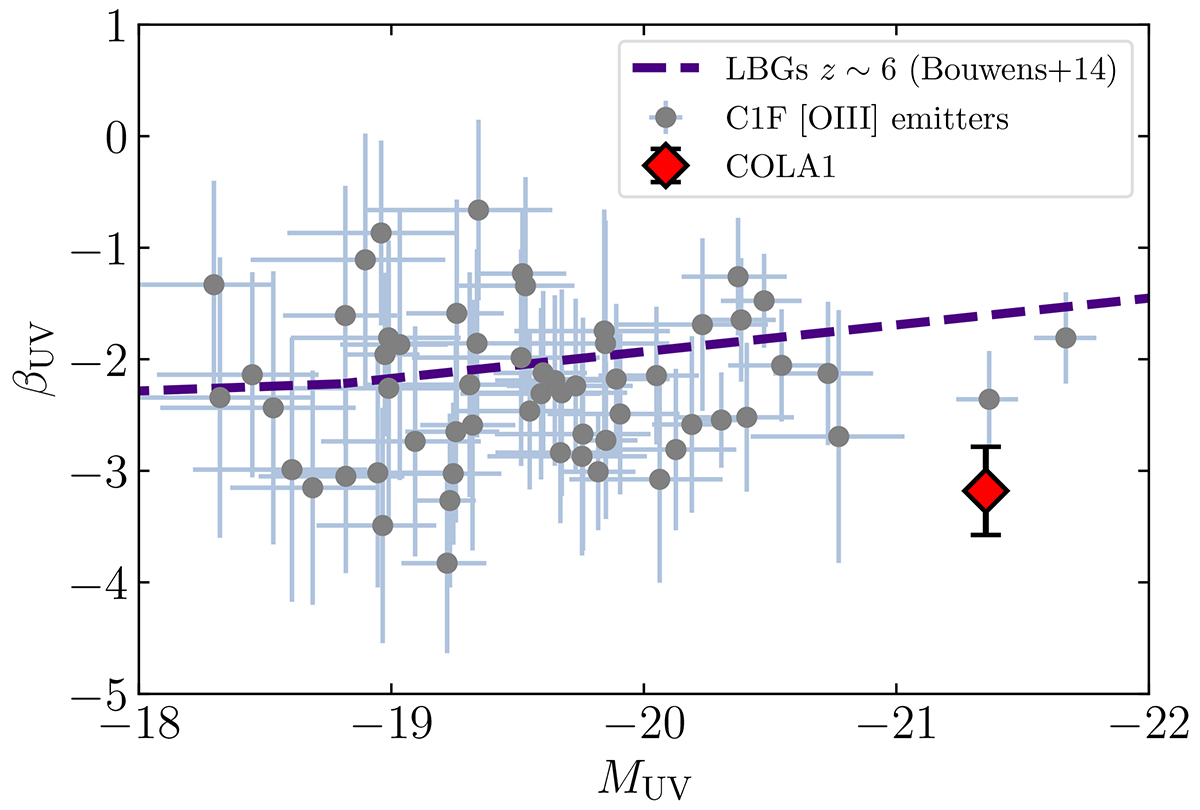
Observed UV slope measured by fitting a power law spectrum to the F115W and F150W photometry. The shown MUV is computed from the best-fit used to obtain βUV. COLA1 presents a steep slope in comparison with other bright [O III] emitters in C1F. Only objects with S/N > 5 in F115W and F150W are shown. We also compare with the estimated average βUV in Bouwens et al. (2014) for LBGs at z ∼ 6.
Current usage metrics show cumulative count of Article Views (full-text article views including HTML views, PDF and ePub downloads, according to the available data) and Abstracts Views on Vision4Press platform.
Data correspond to usage on the plateform after 2015. The current usage metrics is available 48-96 hours after online publication and is updated daily on week days.
Initial download of the metrics may take a while.