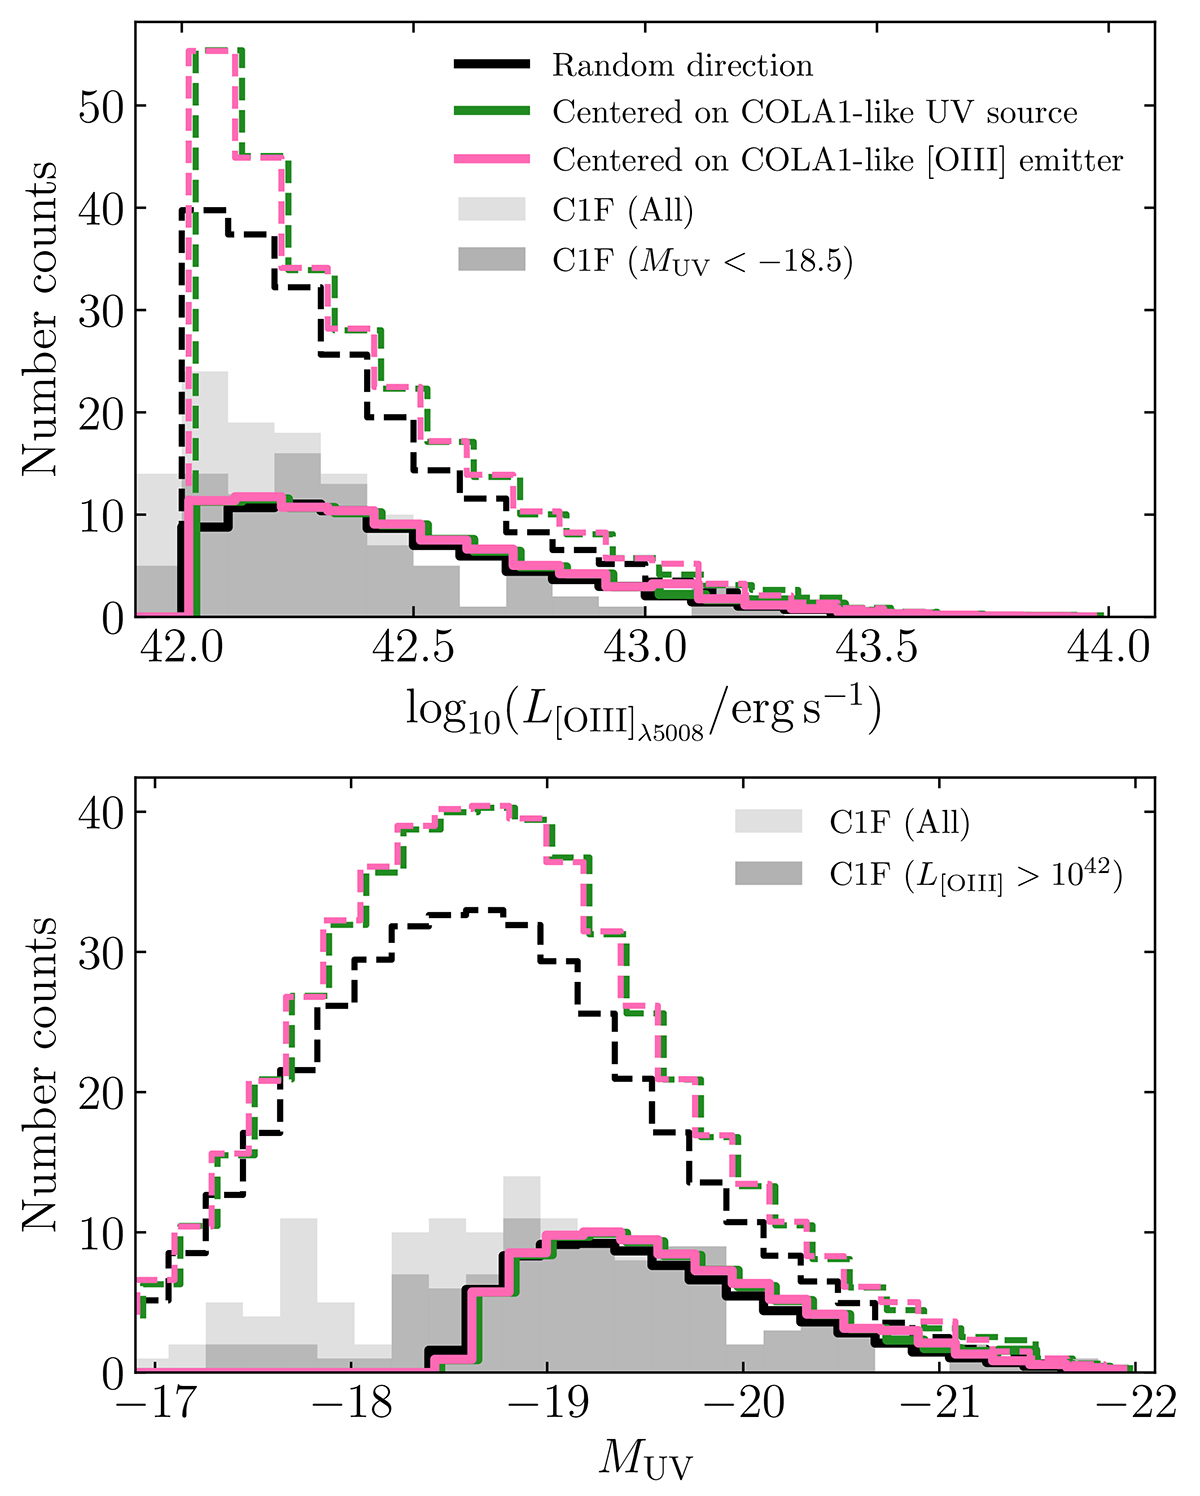
Fig. 7.
Download original image
Distribution of [O III]λ5008 luminosity and UV absolute magnitude of the Uchuu mocks and C1F. The black, pink and green histograms represent the distributions in Uchuu with random directions and centered in objects with similar L[O III] and MUV to COLA1, respectively. The dashed histograms represent all the objects in the field, and the solid ones only the detected objects. The bins of the three versions of the mock are slightly shifted for visual clarity. The solid gray histograms represent the distributions of the C1F [O III] emitters. The distributions of C1F match the ones of the Uchuu mocks, after running the detection algorithm.
Current usage metrics show cumulative count of Article Views (full-text article views including HTML views, PDF and ePub downloads, according to the available data) and Abstracts Views on Vision4Press platform.
Data correspond to usage on the plateform after 2015. The current usage metrics is available 48-96 hours after online publication and is updated daily on week days.
Initial download of the metrics may take a while.