Open Access
Fig. 6.
Download original image
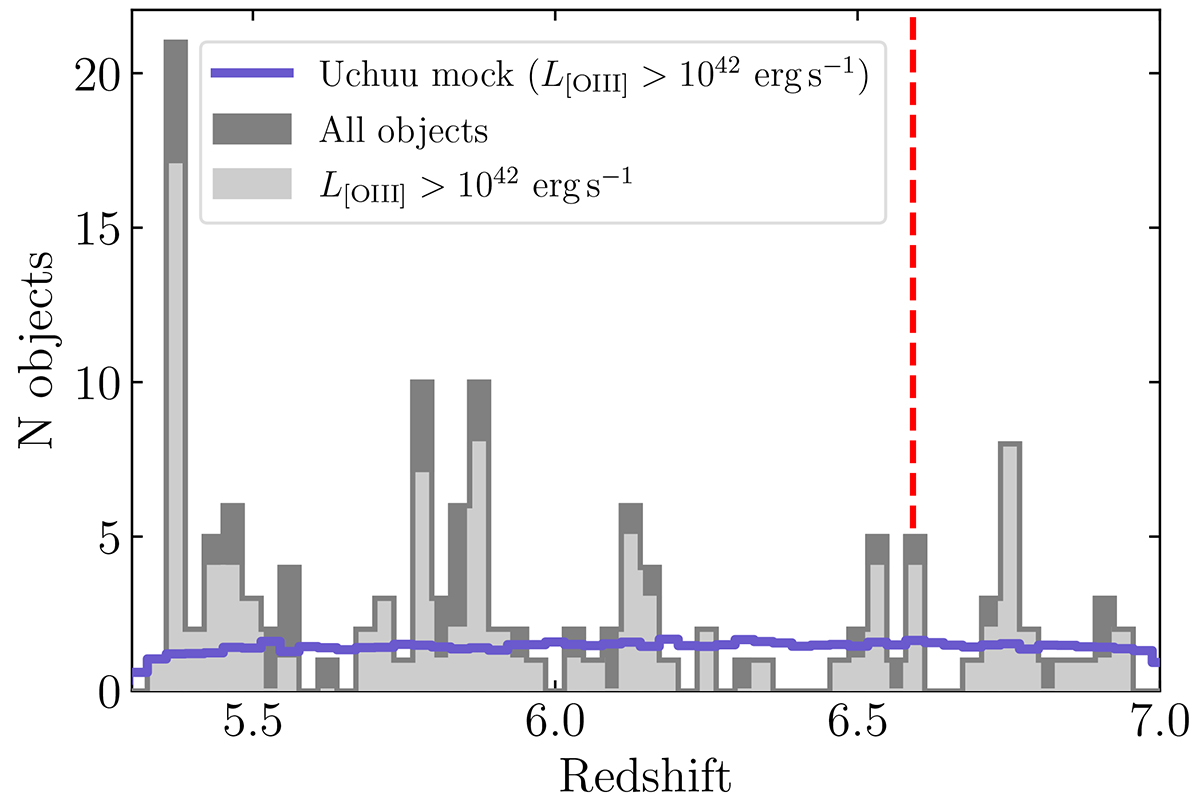
Redshift distribution of the objects selected via [O III] doublet search. The redshift of COLA1 is marked with a dashed red line. The blue solid line represents the average number of objects detected in the 1000 random Uchuu mocks, which converges to the average expectation value.
Current usage metrics show cumulative count of Article Views (full-text article views including HTML views, PDF and ePub downloads, according to the available data) and Abstracts Views on Vision4Press platform.
Data correspond to usage on the plateform after 2015. The current usage metrics is available 48-96 hours after online publication and is updated daily on week days.
Initial download of the metrics may take a while.