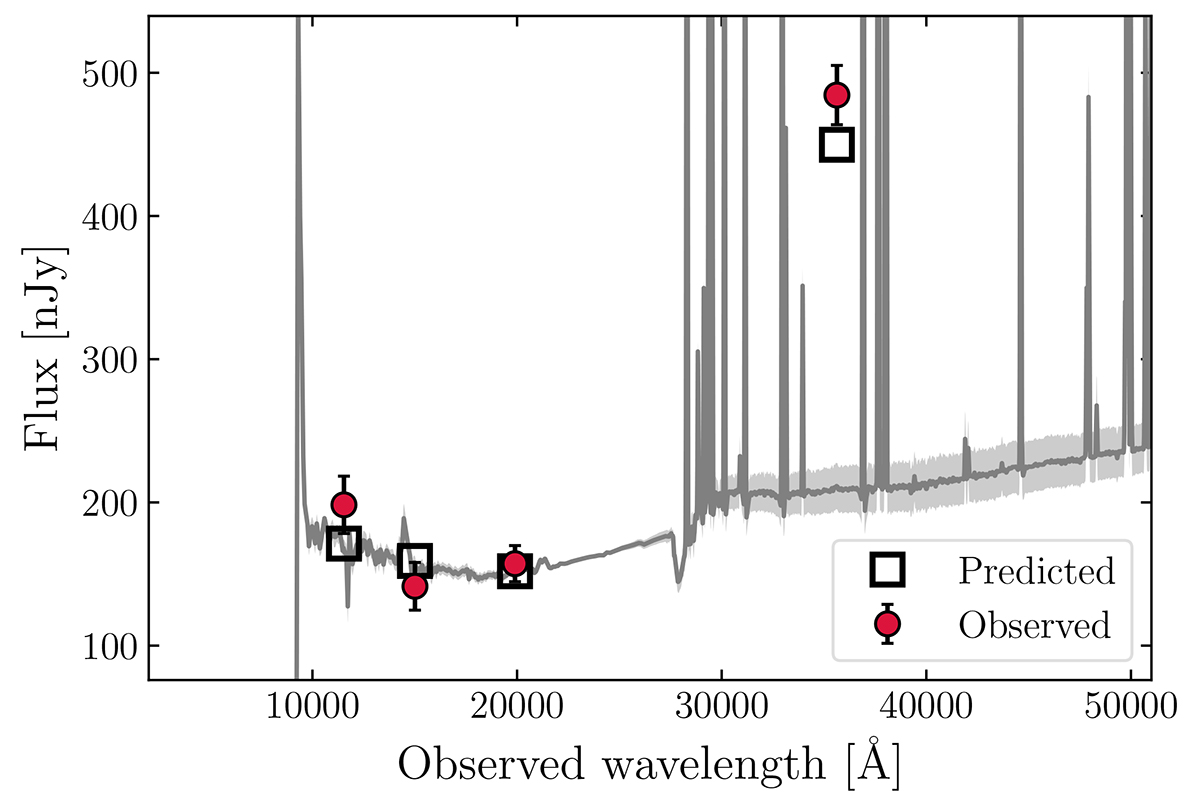
Fig. 5.
Download original image
Best-fit Prospector spectral energy distribution for COLA1 (gray line) and all models allowed within 1σ (gray shaded regions). The errors of the observed photometry are increased by a factor three for visual clarity. The code fails to reproduce the steep blue slope seen in the observed F115W-F150W color. The predicted F356W flux is also lower than observed, causing a slight underestimate the EW of the optical lines [O III] +Hβ.
Current usage metrics show cumulative count of Article Views (full-text article views including HTML views, PDF and ePub downloads, according to the available data) and Abstracts Views on Vision4Press platform.
Data correspond to usage on the plateform after 2015. The current usage metrics is available 48-96 hours after online publication and is updated daily on week days.
Initial download of the metrics may take a while.