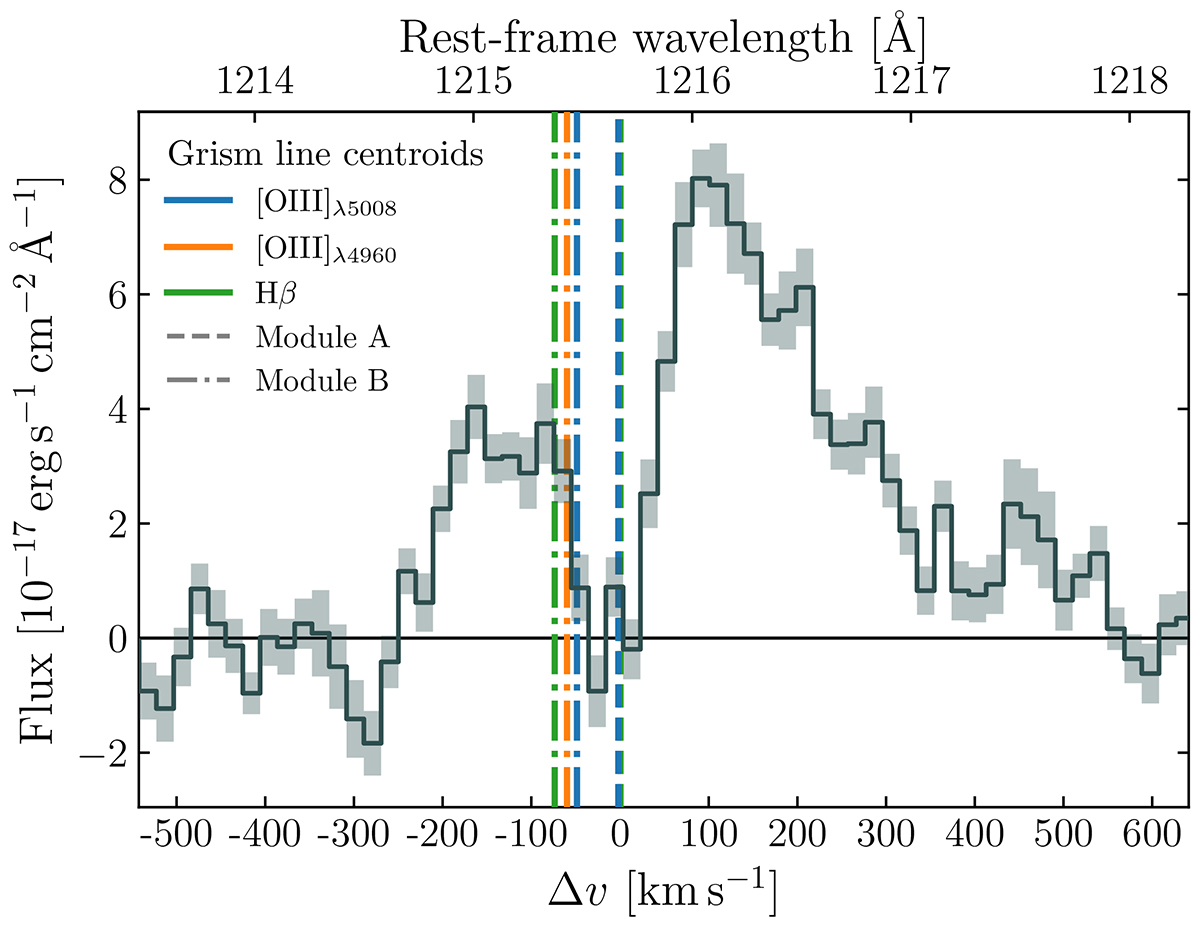
Fig. 4.
Download original image
Lyα profile of COLA1 obtained from the VLT/X-shooter UV spectrum. We assume a systemic redshift of z = 6.59165, the average redshift measured in the NIRCam grism data in module A. The dashed (dot-dashed) color lines mark the position of the systemic Lyα wavelength suggested by the redshifts obtained from the centroids of [O III]λ5008, [O III]λ4960 and Hβ lines in module A (module B) of the WFSS data. For module A the variation in the horizontal direction is lower than the width of the marker lines.
Current usage metrics show cumulative count of Article Views (full-text article views including HTML views, PDF and ePub downloads, according to the available data) and Abstracts Views on Vision4Press platform.
Data correspond to usage on the plateform after 2015. The current usage metrics is available 48-96 hours after online publication and is updated daily on week days.
Initial download of the metrics may take a while.