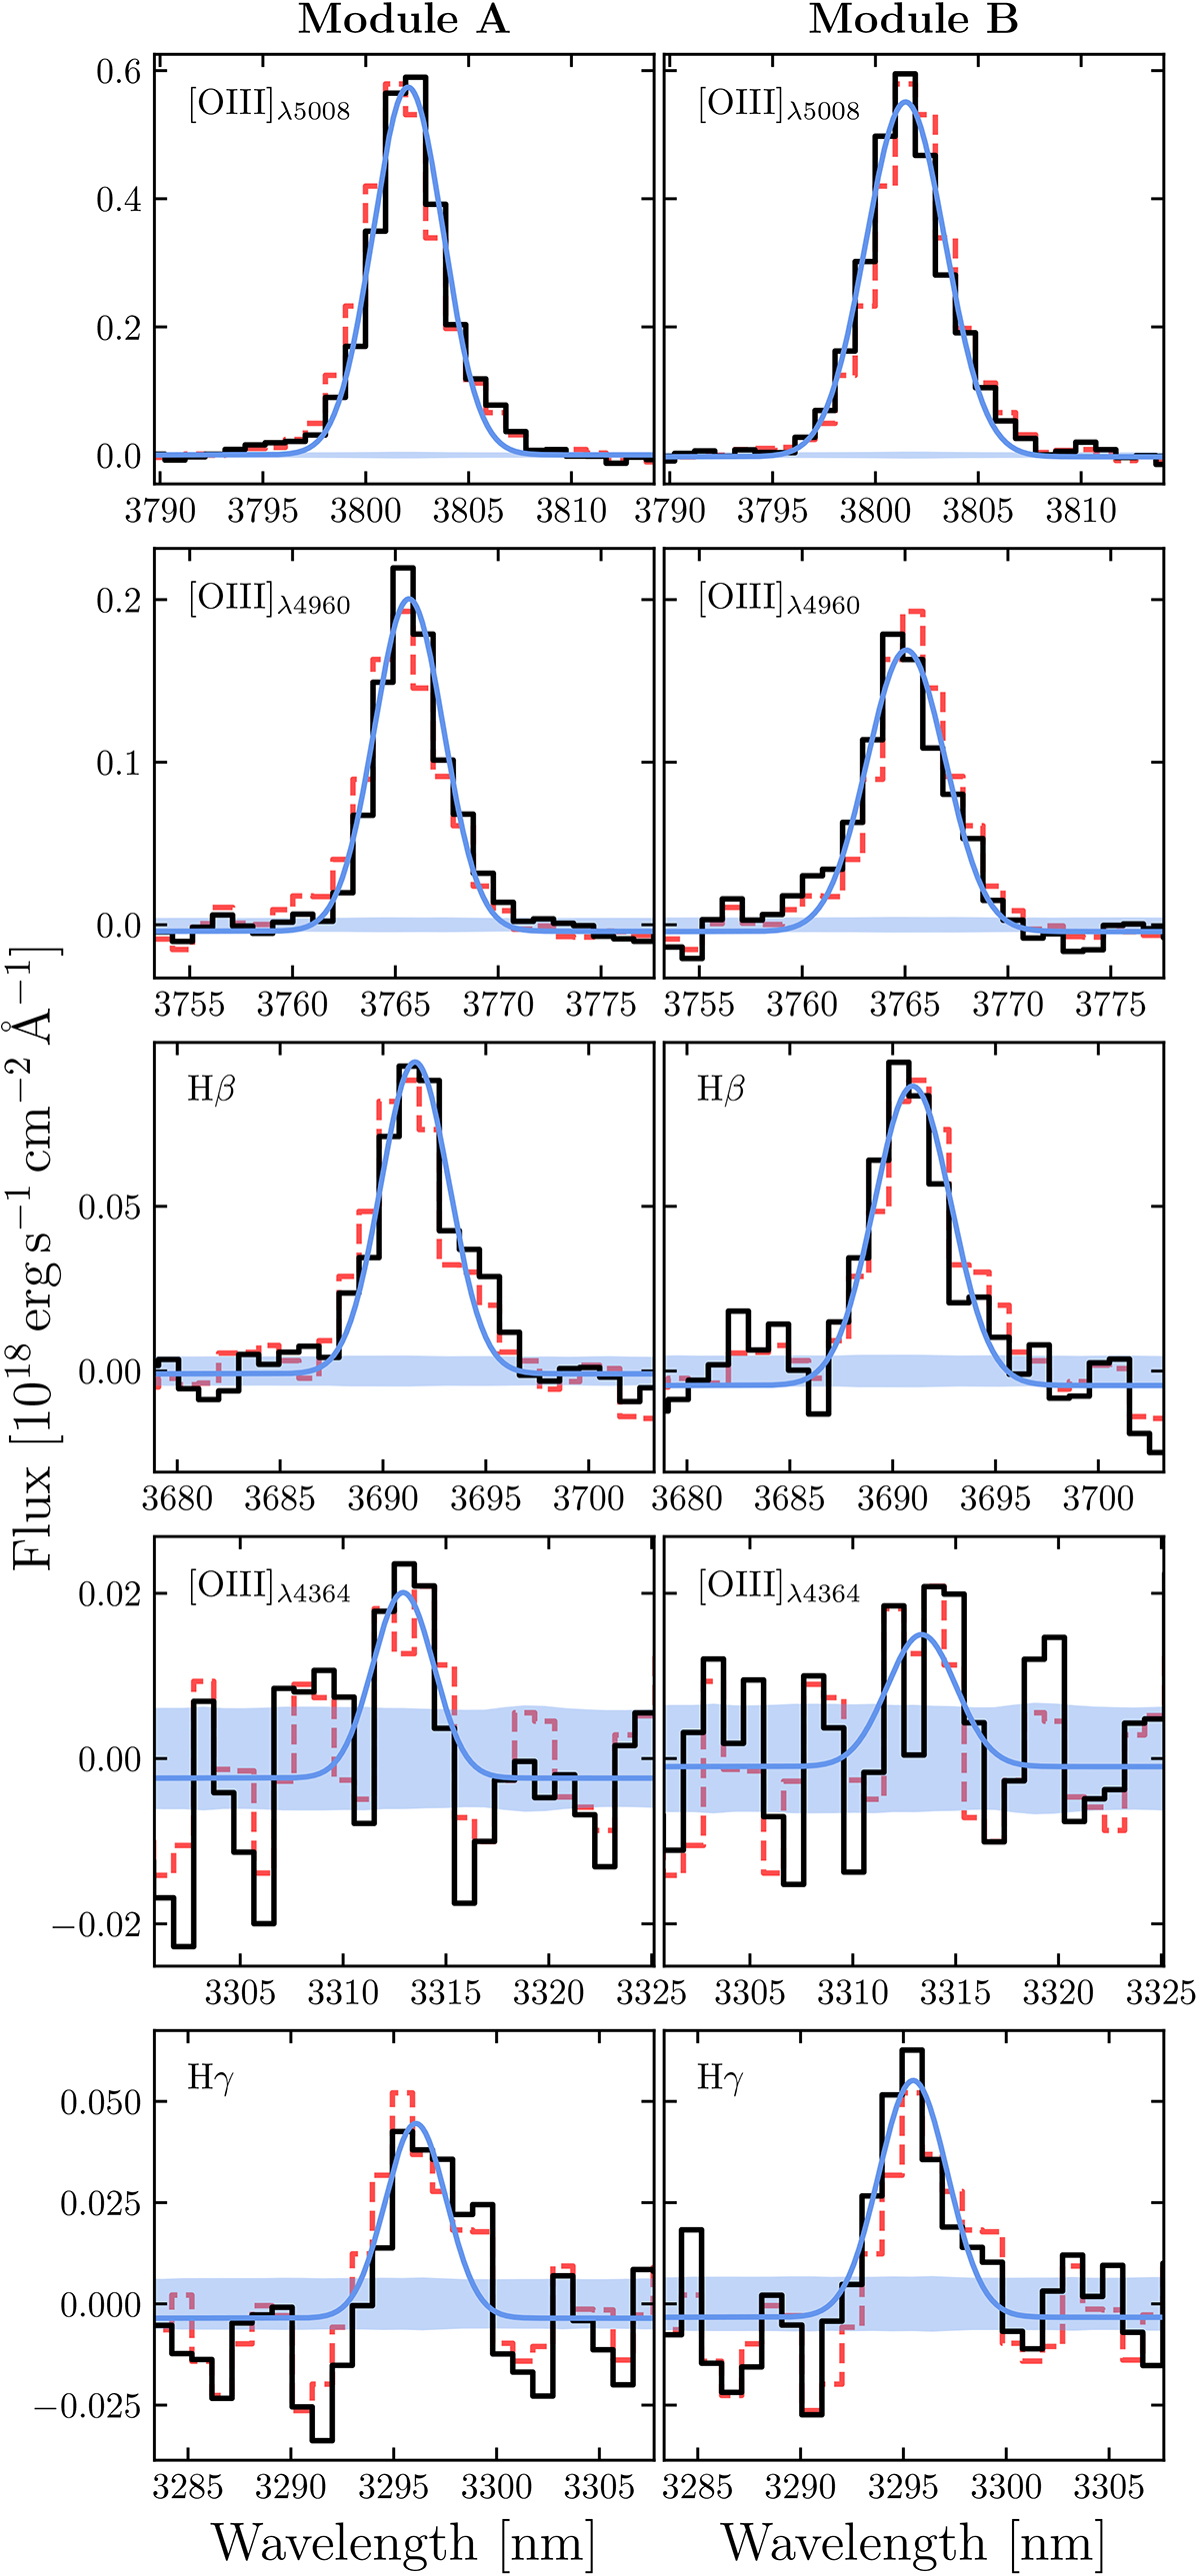
Fig. 3.
Download original image
Gaussian line fits (blue line) to the extracted 1D COLA1 spectrum (black line) for [O III]λ5008, [O III]λ4960, Hβ, [O III]λ4364 and Hγ. We show the results for module A and B separately. The 1σ noise level of the 1D spectrum is represented as the blue shaded region around the zero level. The dashed red lines represent the average flux between modules A and B.
Current usage metrics show cumulative count of Article Views (full-text article views including HTML views, PDF and ePub downloads, according to the available data) and Abstracts Views on Vision4Press platform.
Data correspond to usage on the plateform after 2015. The current usage metrics is available 48-96 hours after online publication and is updated daily on week days.
Initial download of the metrics may take a while.