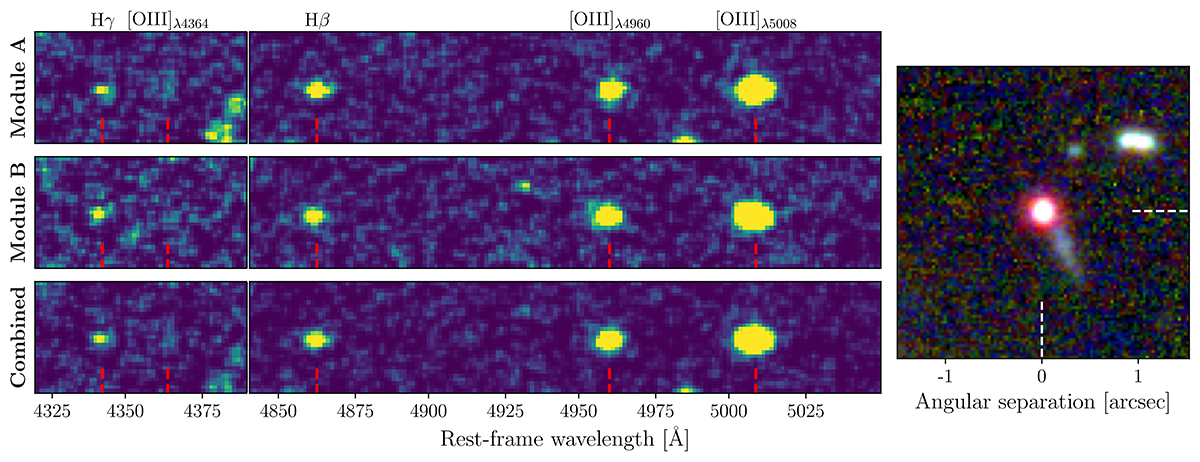
Fig. 2.
Download original image
2D grism spectrum of COLA1 in the regions where the most luminous lines are visible. The three rows of panels on the left side of the figure contain the EMLINE fluxes of modules A and B, as well as the average flux of both modules. The x axis shows the rest-frame wavelength assuming a redshift of z = 6.59165. The right panel displays the false-color NIRCam image of COLA1, oriented with our position angle of 295 deg. We note that the blue extended ‘tail’ is a B-band detected foreground contaminant at z ≤ 2.5 (see Appendix B; see also Matthee et al. 2018).
Current usage metrics show cumulative count of Article Views (full-text article views including HTML views, PDF and ePub downloads, according to the available data) and Abstracts Views on Vision4Press platform.
Data correspond to usage on the plateform after 2015. The current usage metrics is available 48-96 hours after online publication and is updated daily on week days.
Initial download of the metrics may take a while.