Fig. 11.
Download original image
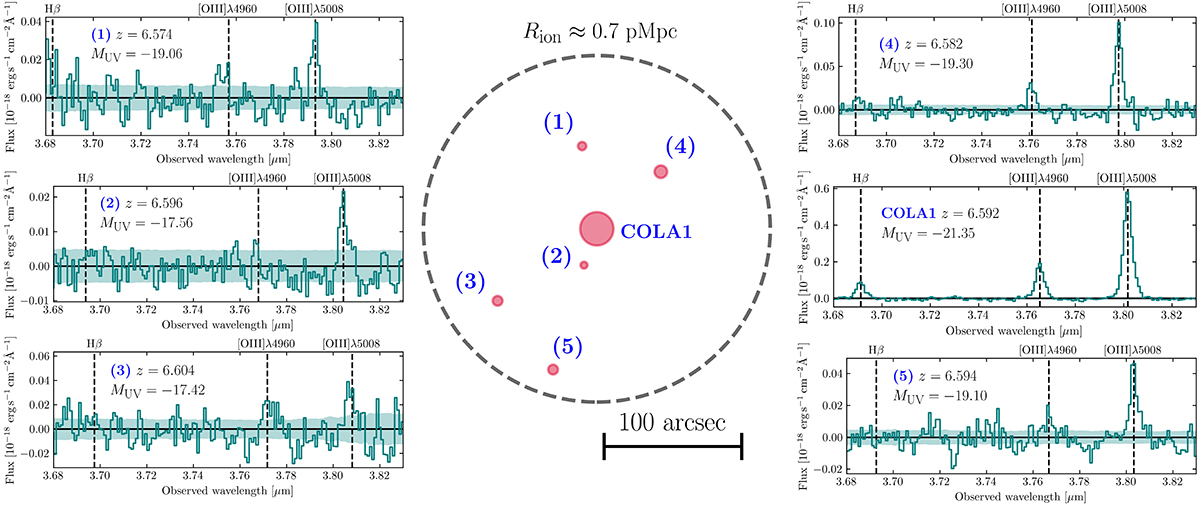
Projected sky positions of COLA1 and the other [O III] emitters with z = zCOLA1 ± 0.02 in our sample (red circles). The size of the marker is proportional to the total [O III] flux of each source. The dashed line marks the estimated ionized bubble size (Mason & Gronke 2020), assuming a spherically symmetric bubble. All the sources found in the environment of COLA1 have projected distances smaller than the bubble radius, suggesting that they could be located inside the bubble. We show the 1D spectra of all the sources, in the observed wavelength range of the [O III] doublet and Hβ. The blue shaded regions mark the 1σ confidence interval of the spectroscopic fluxes. False-color images and 2D grism spectra of these sources can be found in Appendix C.
Current usage metrics show cumulative count of Article Views (full-text article views including HTML views, PDF and ePub downloads, according to the available data) and Abstracts Views on Vision4Press platform.
Data correspond to usage on the plateform after 2015. The current usage metrics is available 48-96 hours after online publication and is updated daily on week days.
Initial download of the metrics may take a while.