Fig. 9.
Download original image
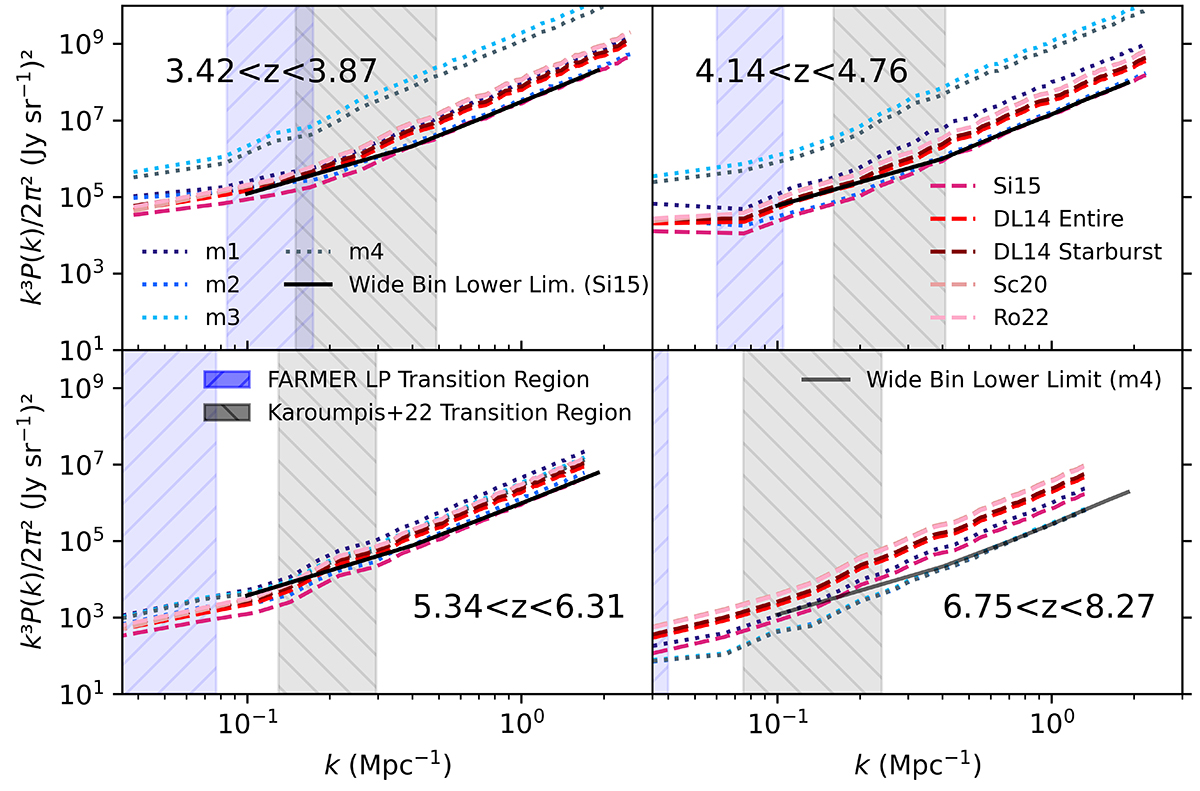
Power spectra of models m1-m4, Si15, DL14, Sc20 and Ro22 for all redshift bands, demonstrating a spread of up to 2 dex. We always show power spectra in the k3P(k)/2π2 format. Differences in maximum and minimum k with regards to redshift are due to different beam and map size. The lines are kept consistent across all future graphs, however, the colours change to display the contrast with respect to previous simulation works. While most of these power spectra are shown with narrower k bins as discussed in Sect. 2.6, we also overlay the wider k bin versions (Δk = 0.3 Mpc−1) of the absolute minimum power spectra (Si15 for most redshifts, m4 for 6.75 < z < 8.27). These minimum values are quantified in Table 3. The upturn at small k for these lower limits is due to using wider k bins compared to the other power spectra. The transition region (see text) for our calculated models is shown in hatched blue, with a transition region from Karoumpis et al. (2022) shown in hatched grey for contrast.
Current usage metrics show cumulative count of Article Views (full-text article views including HTML views, PDF and ePub downloads, according to the available data) and Abstracts Views on Vision4Press platform.
Data correspond to usage on the plateform after 2015. The current usage metrics is available 48-96 hours after online publication and is updated daily on week days.
Initial download of the metrics may take a while.