Fig. 8.
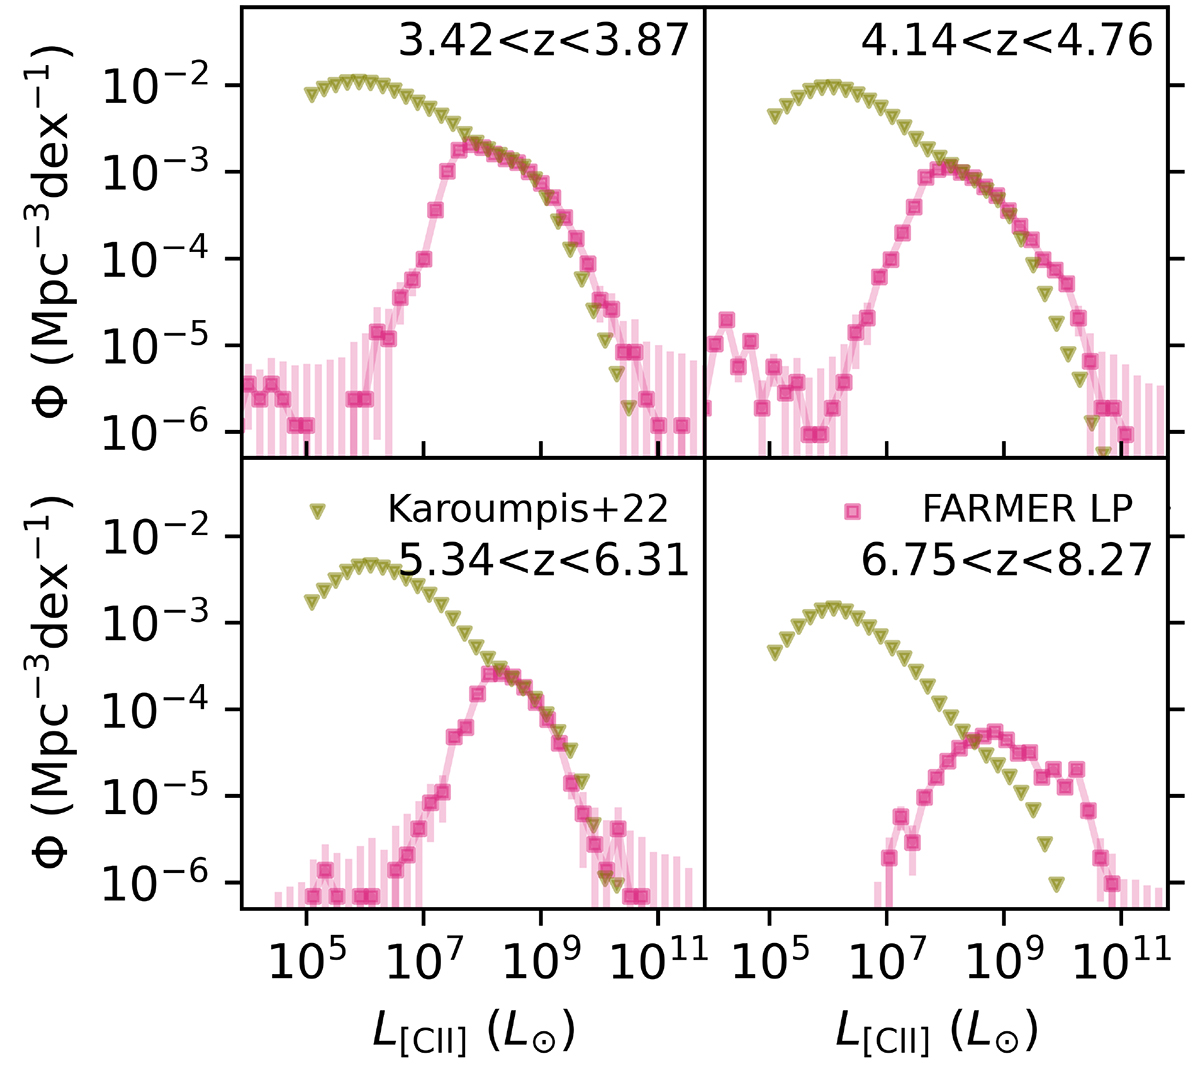
Download original image
Luminosity functions of FARMER LP in the four frequency bins within the range of EoR-Spec, including the extrapolated mask galaxies, shown down to 104 L⊙. Comparison luminosity functions in the same redshift bands from Karoumpis et al. (2022) are also shown. As they used the [CII] model from Eq. (8) of Vallini et al. (2015), we applied the same model to ensure consistency. We did not include this SFR- and metallicity-based [CII] model in our wider analysis because it was derived from radiative transfer cosmological simulations instead of from an existing sample. For all redshift bands there is a clear discrepancy below 108 L⊙, as the models from Karoumpis et al. (2022) assume a significant population exists below this point, which FARMER LP does not have. At lower redshift bands, especially visible for 4.14 < z < 4.76, we see small upturns in the luminosity function below 106 L⊙. In addition, the luminosity function of FARMER LP shows larger populations of high-luminosity galaxies for all bands except 5.34 < z < 6.31. This is most noticeable for 6.75 < z < 8.27, where our function is greater by 1 dex. These deviations are likely caused or exacerbated by the propagated errors when calculating [CII] luminosity, as shown by the shaded error bars.
Current usage metrics show cumulative count of Article Views (full-text article views including HTML views, PDF and ePub downloads, according to the available data) and Abstracts Views on Vision4Press platform.
Data correspond to usage on the plateform after 2015. The current usage metrics is available 48-96 hours after online publication and is updated daily on week days.
Initial download of the metrics may take a while.