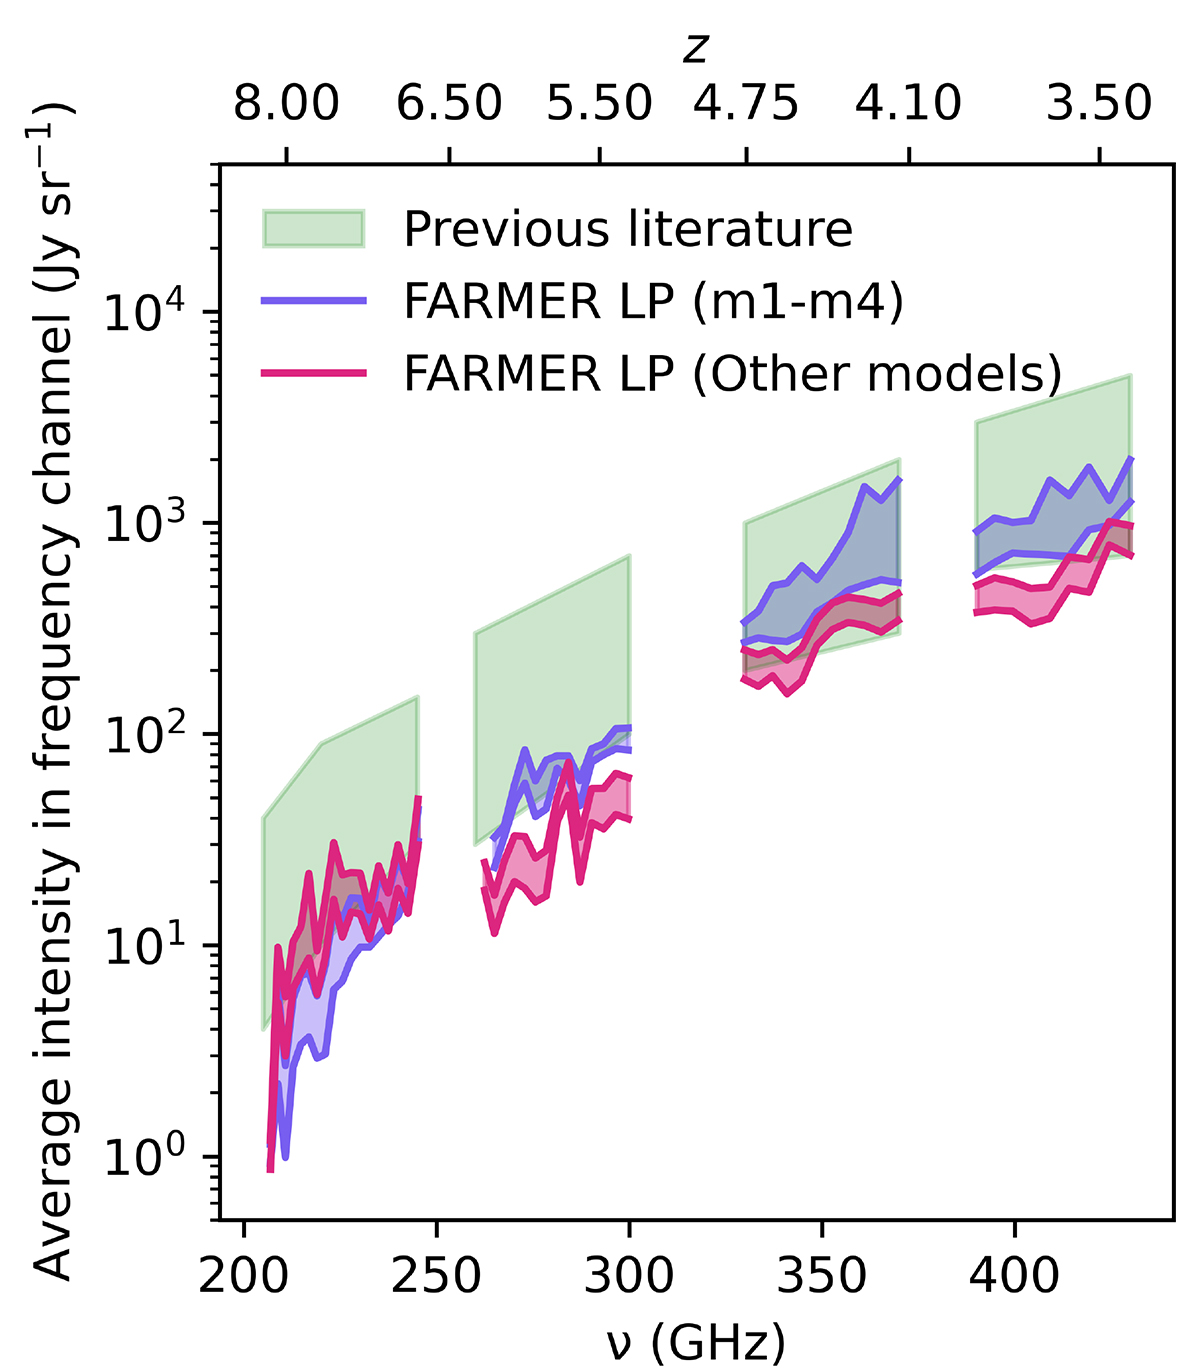
Fig. 7.
Download original image
Average [CII] intensity of slices of the 3D intensity cubes (in units of Jy sr−1), plotted against the frequencies and redshifts of the respective slices. We separate the results from our cubes into the models from ALPINE and the models from the previous literature, in blue and purple respectively. We compared the results of our cubes to the equivalent statistic from previous simulated cubes in green (all taken from Karoumpis et al. 2022, including itself and Yue et al. 2015; Breysse et al. 2017; Chung et al. 2020).
Current usage metrics show cumulative count of Article Views (full-text article views including HTML views, PDF and ePub downloads, according to the available data) and Abstracts Views on Vision4Press platform.
Data correspond to usage on the plateform after 2015. The current usage metrics is available 48-96 hours after online publication and is updated daily on week days.
Initial download of the metrics may take a while.