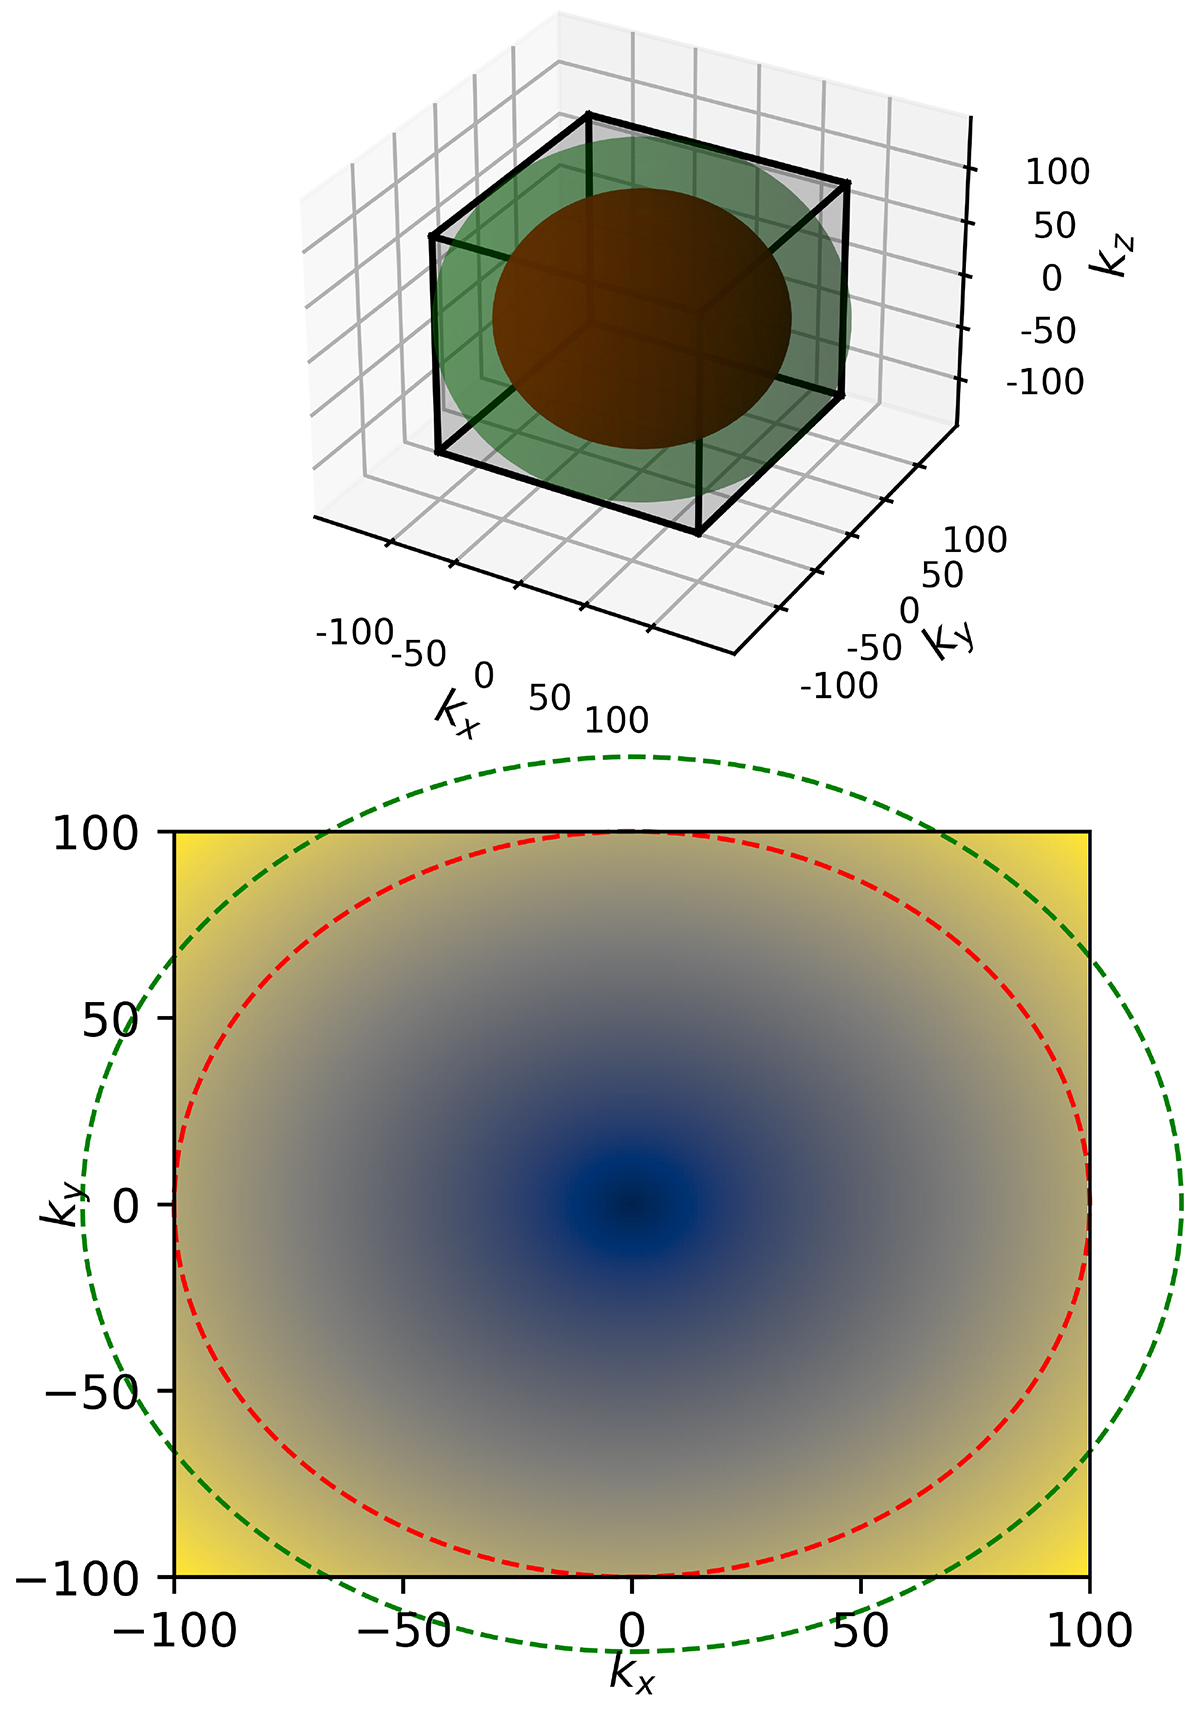
Fig. 6.
Download original image
Fourier modes of a 3D cube and a 2D map (upper and lower subplot respectively), in the manner of Ponthieu et al. (2011). The power spectrum P(k) at a given k value is the average of all spatial frequencies with the same magnitude, that is concentric shells or rings around the centre where k = 0. The inner shell or circle in red, which touches the edges of the box, is the largest k value where all k modes can be included. All k values with higher magnitude, such as the outer shell or circle in green, lie outside the box and thus miss k modes, introducing greater uncertainties in the corresponding power spectrum value. In these examples k is unit-less.
Current usage metrics show cumulative count of Article Views (full-text article views including HTML views, PDF and ePub downloads, according to the available data) and Abstracts Views on Vision4Press platform.
Data correspond to usage on the plateform after 2015. The current usage metrics is available 48-96 hours after online publication and is updated daily on week days.
Initial download of the metrics may take a while.