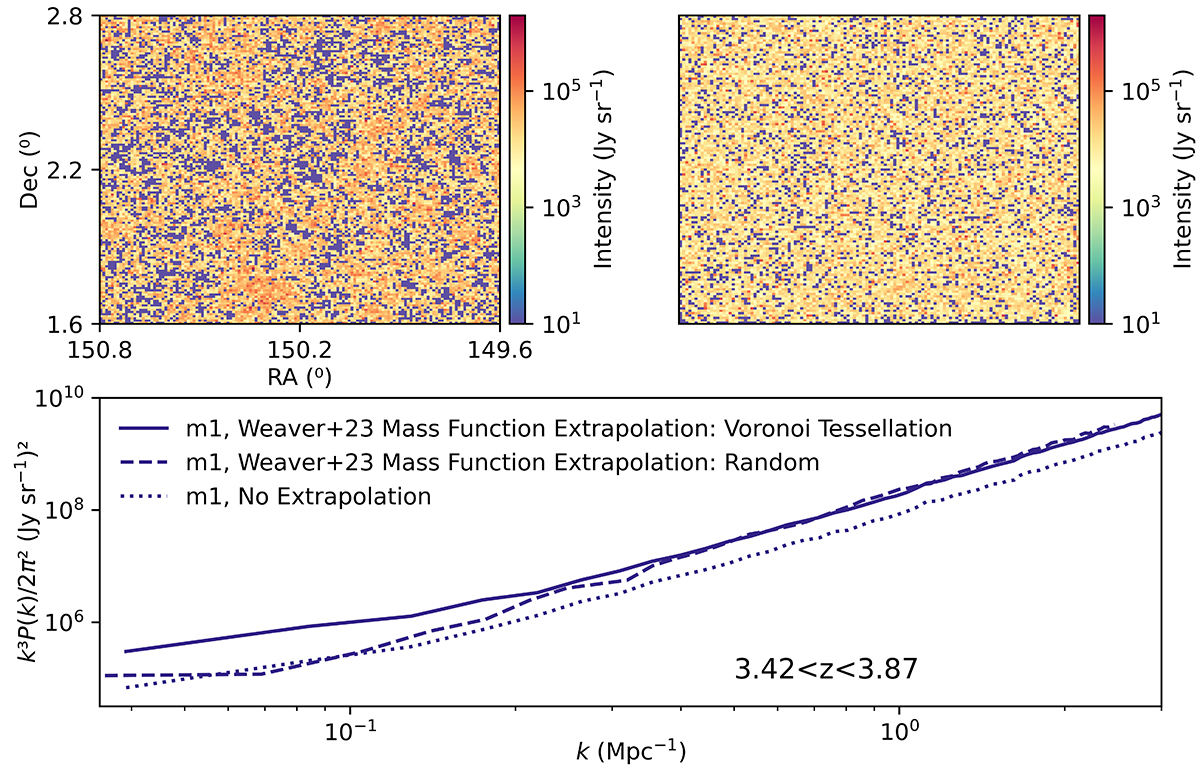
Fig. B.4.
Download original image
Comparison of power spectra demonstrating the impact of VT on extrapolation. In the left subplot we show a cross-section of the LIM cube at 3.42 < z < 3.87 for m1 when using VT to select galaxy location. In the right subplot we see the same, except for the random location selection case. In the lower subplot we compare the power spectra.
Current usage metrics show cumulative count of Article Views (full-text article views including HTML views, PDF and ePub downloads, according to the available data) and Abstracts Views on Vision4Press platform.
Data correspond to usage on the plateform after 2015. The current usage metrics is available 48-96 hours after online publication and is updated daily on week days.
Initial download of the metrics may take a while.