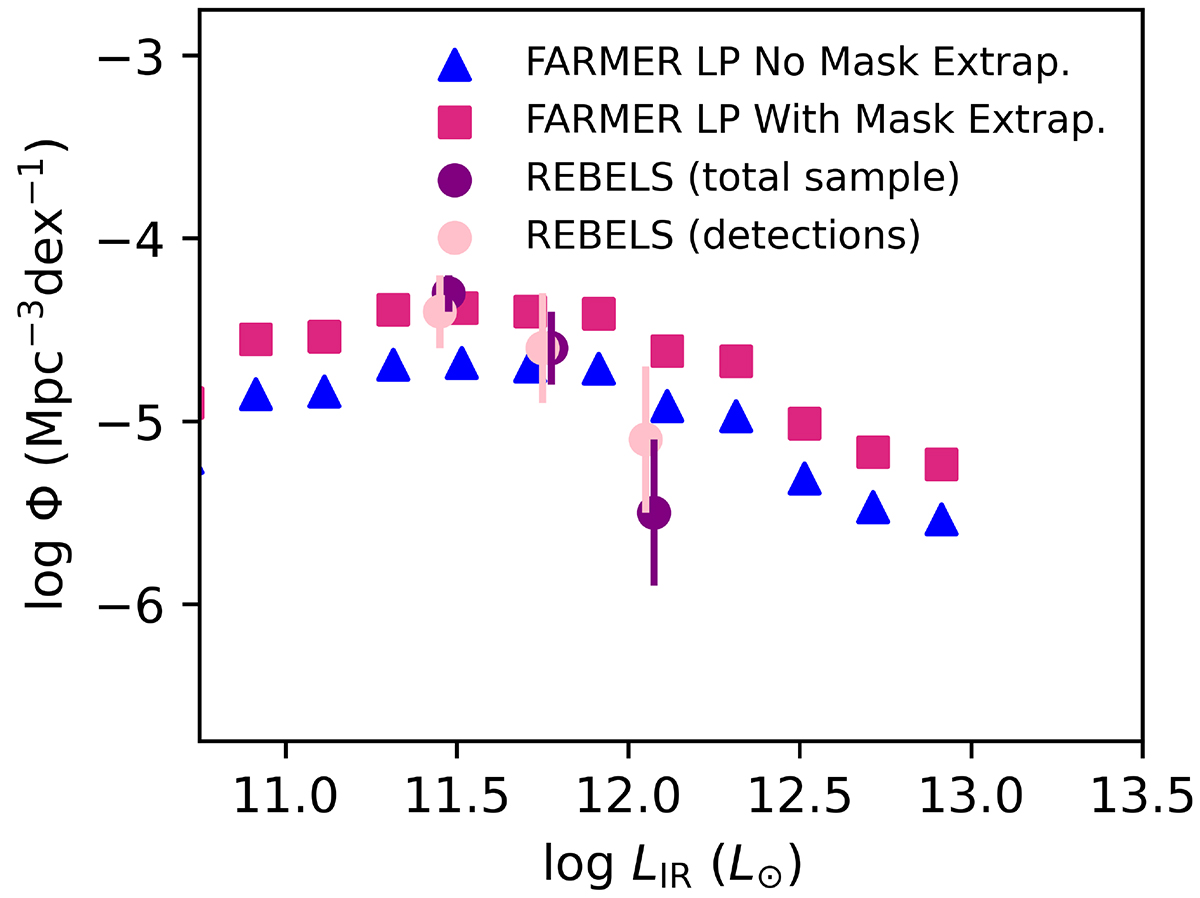
Fig. B.3.
Download original image
Comparison of the IR luminosity functions of REBELS when using the entire sample or when using only detections, and FARMER LP with and without mask extrapolation. We do not plot the predicted ranges of Schechter functions from Barrufet et al. (2023) due to the limited number of data points. The points of the REBELS functions are at the same luminosity, and are slightly offset in the figure to increase clarity.
Current usage metrics show cumulative count of Article Views (full-text article views including HTML views, PDF and ePub downloads, according to the available data) and Abstracts Views on Vision4Press platform.
Data correspond to usage on the plateform after 2015. The current usage metrics is available 48-96 hours after online publication and is updated daily on week days.
Initial download of the metrics may take a while.