Open Access
Fig. A.1.
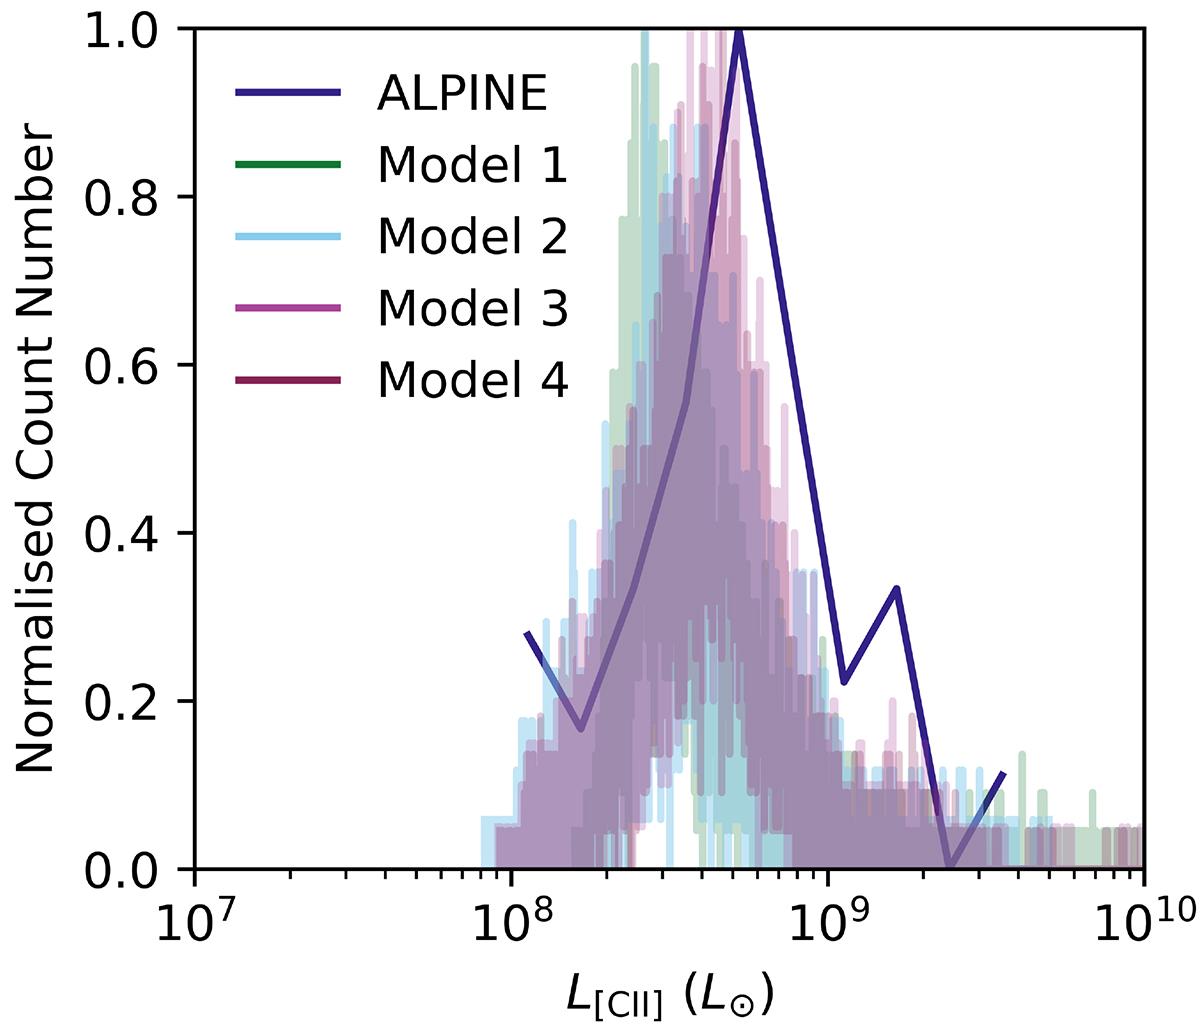
Download original image
Comparison of the histogram of the ALPINE [CII] luminosities compared to m1-m4 histograms when applied to FARMER LP at 4.4 < z < 4.65 and 5.05 < z < 5.9. As these resemble Gaussian distributions, we made fits to these histograms and compared the means and standard deviations.
Current usage metrics show cumulative count of Article Views (full-text article views including HTML views, PDF and ePub downloads, according to the available data) and Abstracts Views on Vision4Press platform.
Data correspond to usage on the plateform after 2015. The current usage metrics is available 48-96 hours after online publication and is updated daily on week days.
Initial download of the metrics may take a while.