Fig. 15.
Download original image
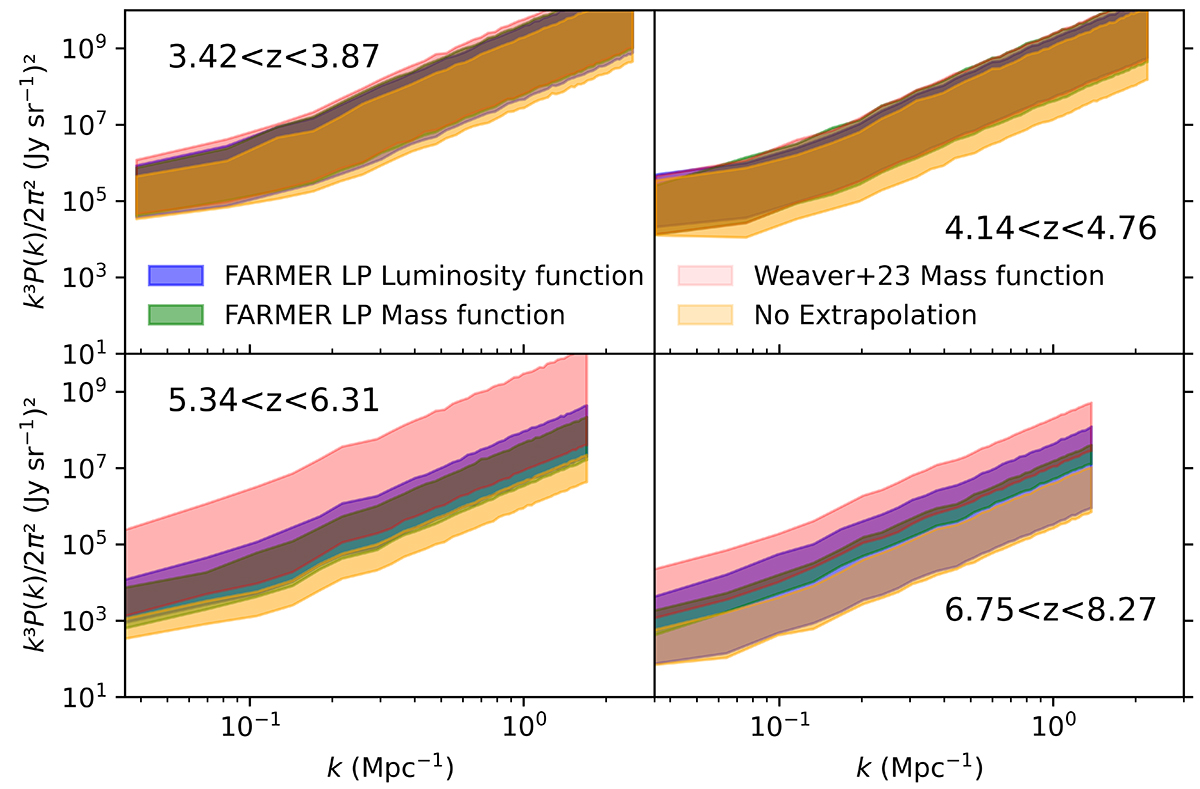
Comparison of extrapolated power spectra from different extrapolation techniques. The models in orange are those from the original FARMER LP sample with no extrapolation, with blue representing FARMER LP luminosity function extrapolation, green representing FARMER LP mass function extrapolation, and red representing mass extrapolation using Weaver et al. (2023) parameters. The key point here is the difference between extrapolated models and the original sample in orange.
Current usage metrics show cumulative count of Article Views (full-text article views including HTML views, PDF and ePub downloads, according to the available data) and Abstracts Views on Vision4Press platform.
Data correspond to usage on the plateform after 2015. The current usage metrics is available 48-96 hours after online publication and is updated daily on week days.
Initial download of the metrics may take a while.