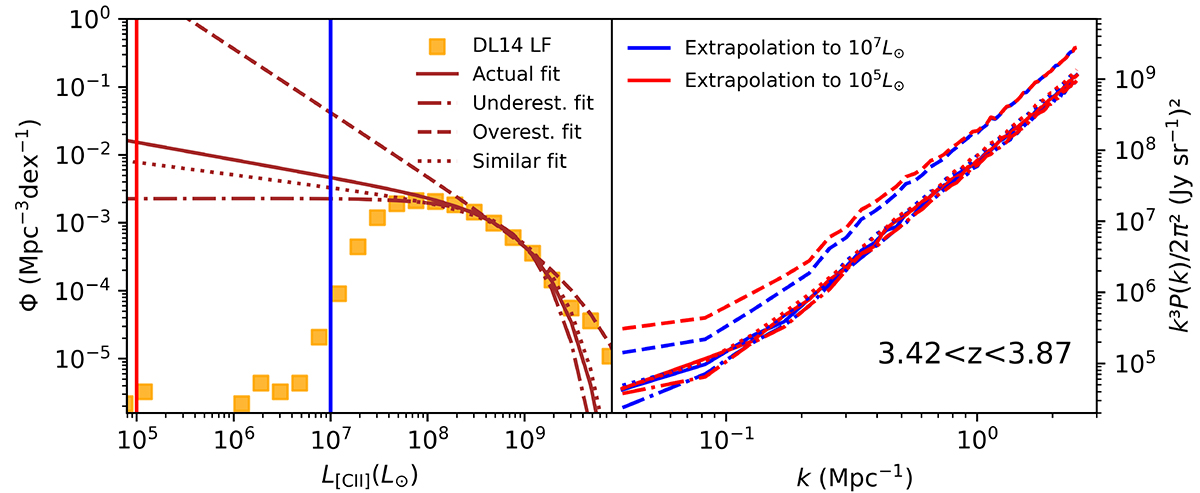
Fig. 13.
Download original image
Comparison of different Schechter curve fits to the DL14 Entire [CII] luminosity function at 3.42 < z < 3.87. This sample includes FARMER LP, the stellar mask and CANDELS factor adjustments. We include the actual fit we chose, as well as fits that are underestimates, overestimates, or were similar. Parameters for these fits are in Appendix D. The left subplot shows the actual Schechter curves themselves, including the two limits of extrapolation we investigate, and the right subplots show the resulting power spectra. The power spectra are mostly similar, except for the ‘overestimate’ case.
Current usage metrics show cumulative count of Article Views (full-text article views including HTML views, PDF and ePub downloads, according to the available data) and Abstracts Views on Vision4Press platform.
Data correspond to usage on the plateform after 2015. The current usage metrics is available 48-96 hours after online publication and is updated daily on week days.
Initial download of the metrics may take a while.