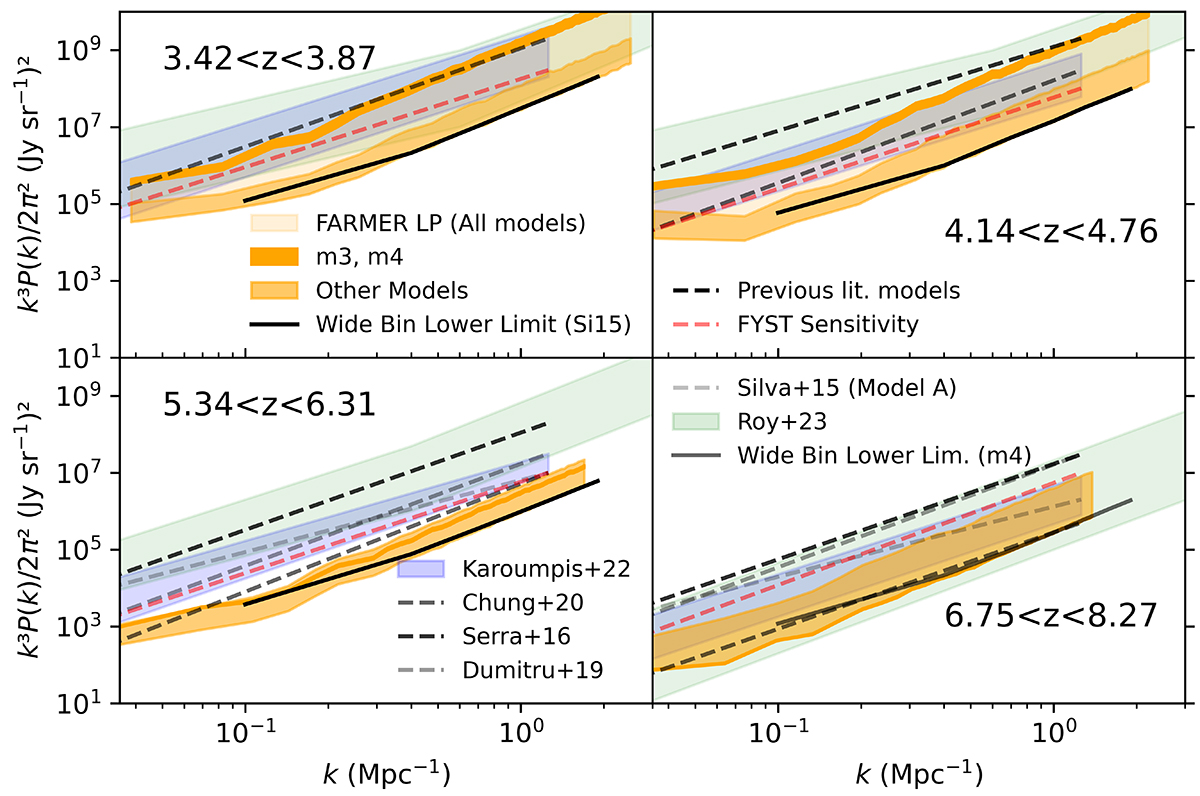
Fig. 10.
Download original image
Power spectra at all frequency channels comparing our work to previous literature power spectra. Our models are grouped together in orange, with different shadings used to highlight models m3 and m4 at 3.42 < z < 3.87 and 4.14 < z < 4.76. We show all models with narrow k bins, equivalent to the best resolution possible, however the lowest models are also shown with bin width Δk = 0.3 Mpc−1, these power spectra having worse resolution but being more accurate to expected observations. Previous simulation work is shown with dashed lines, with the exception of Karoumpis et al. (2022) and Roy et al. (2023), where the range of predictions is shown in blue and green shaded regions respectively. We also include the power spectra of the expected EoR-Spec sensitivity taken from CCAT Collaboration (2023).
Current usage metrics show cumulative count of Article Views (full-text article views including HTML views, PDF and ePub downloads, according to the available data) and Abstracts Views on Vision4Press platform.
Data correspond to usage on the plateform after 2015. The current usage metrics is available 48-96 hours after online publication and is updated daily on week days.
Initial download of the metrics may take a while.