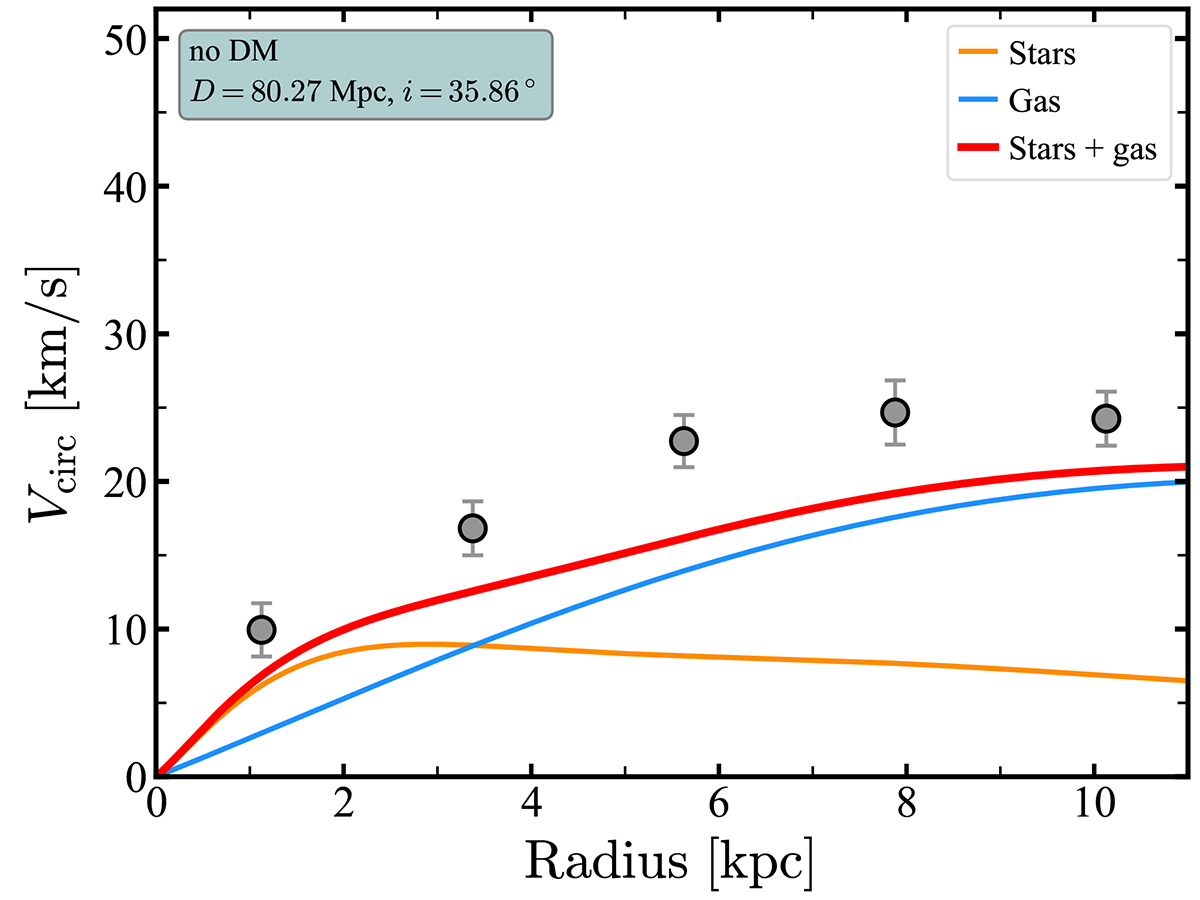
Fig. 7.
Download original image
Baryons-only mass model. The orange and blue curves show the contribution from V* and Vgas to the gravitational potential, respectively. The red curve shows their sum in quadrature. The blue box lists the best-fitting distance and inclination. According to our priors on distance and inclination, the distribution of the baryons alone cannot explain the observed kinematics of AGC 114905.
Current usage metrics show cumulative count of Article Views (full-text article views including HTML views, PDF and ePub downloads, according to the available data) and Abstracts Views on Vision4Press platform.
Data correspond to usage on the plateform after 2015. The current usage metrics is available 48-96 hours after online publication and is updated daily on week days.
Initial download of the metrics may take a while.