Open Access
Fig. 3.
Download original image
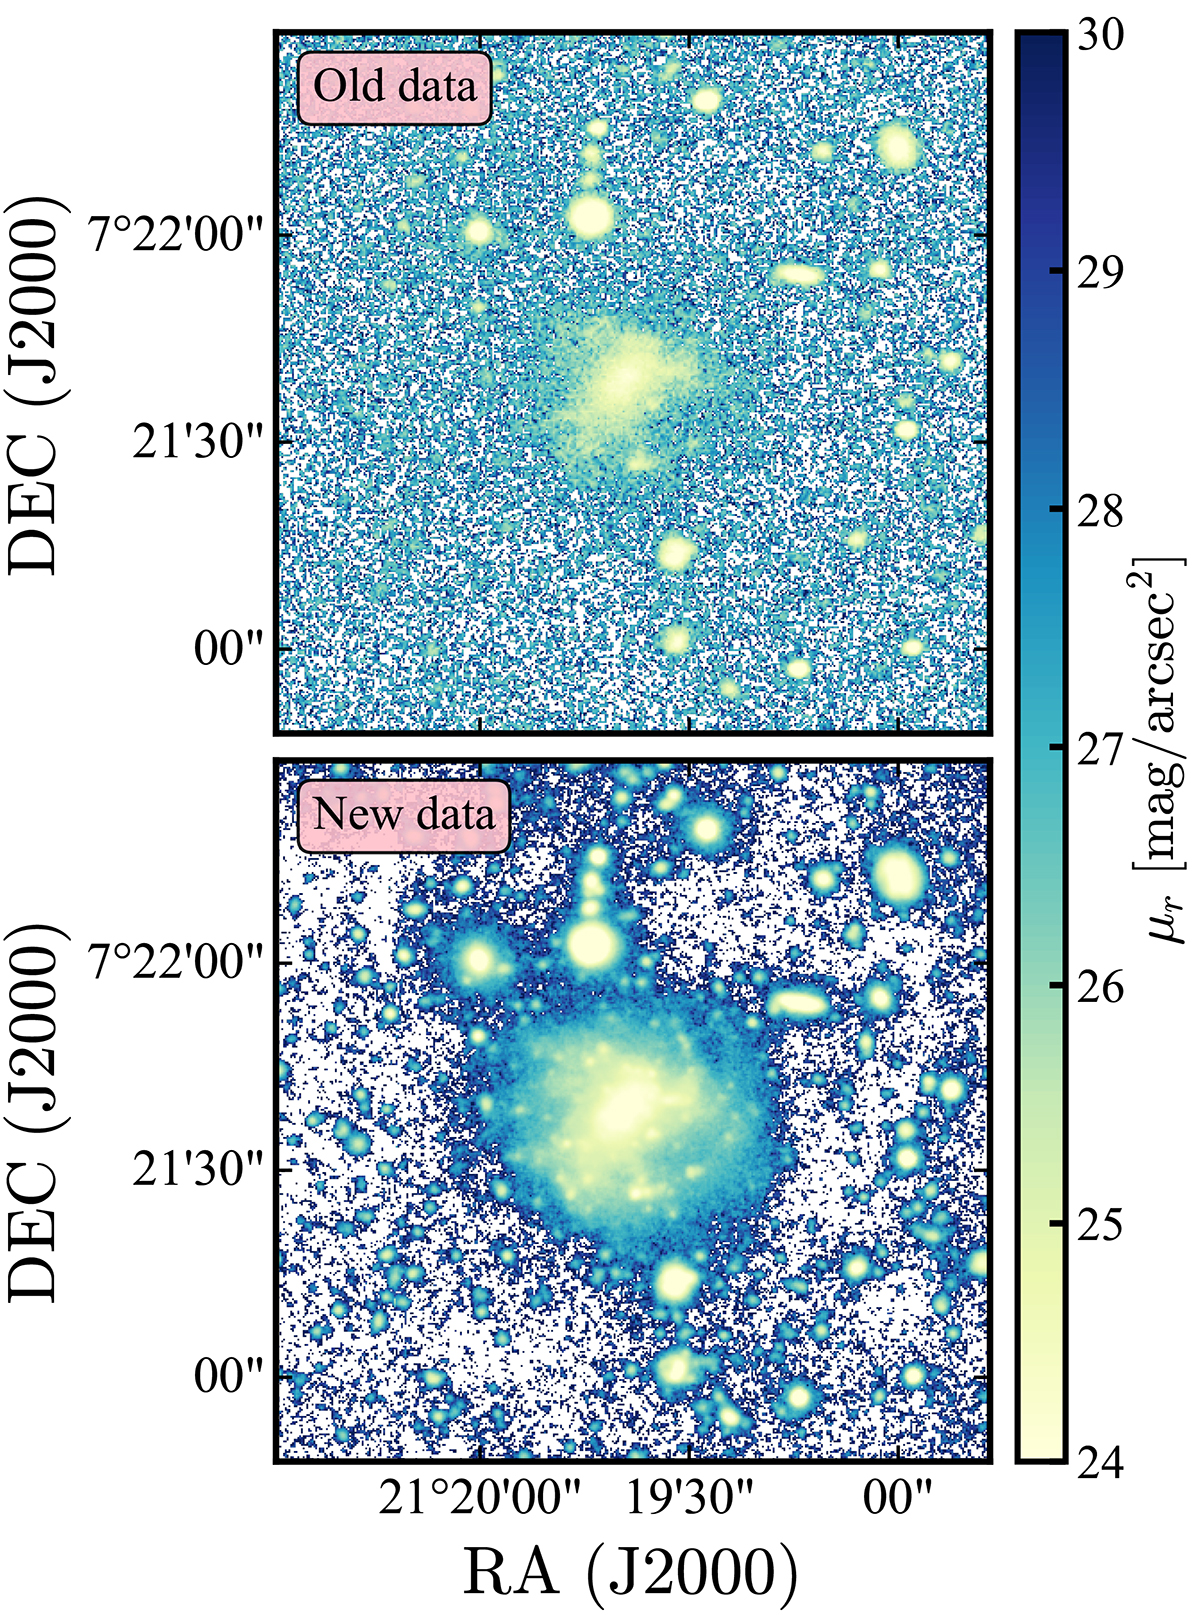
Comparison between the previous r-band imaging of AGC 114905 (top) and the new data (bottom). The colours represent different surface brightness levels. The previous data only traced the brighter central regions, while the new data, going 3 mag/arcsec2 deeper, are able to capture the underlying fainter extended disc.
Current usage metrics show cumulative count of Article Views (full-text article views including HTML views, PDF and ePub downloads, according to the available data) and Abstracts Views on Vision4Press platform.
Data correspond to usage on the plateform after 2015. The current usage metrics is available 48-96 hours after online publication and is updated daily on week days.
Initial download of the metrics may take a while.