Open Access
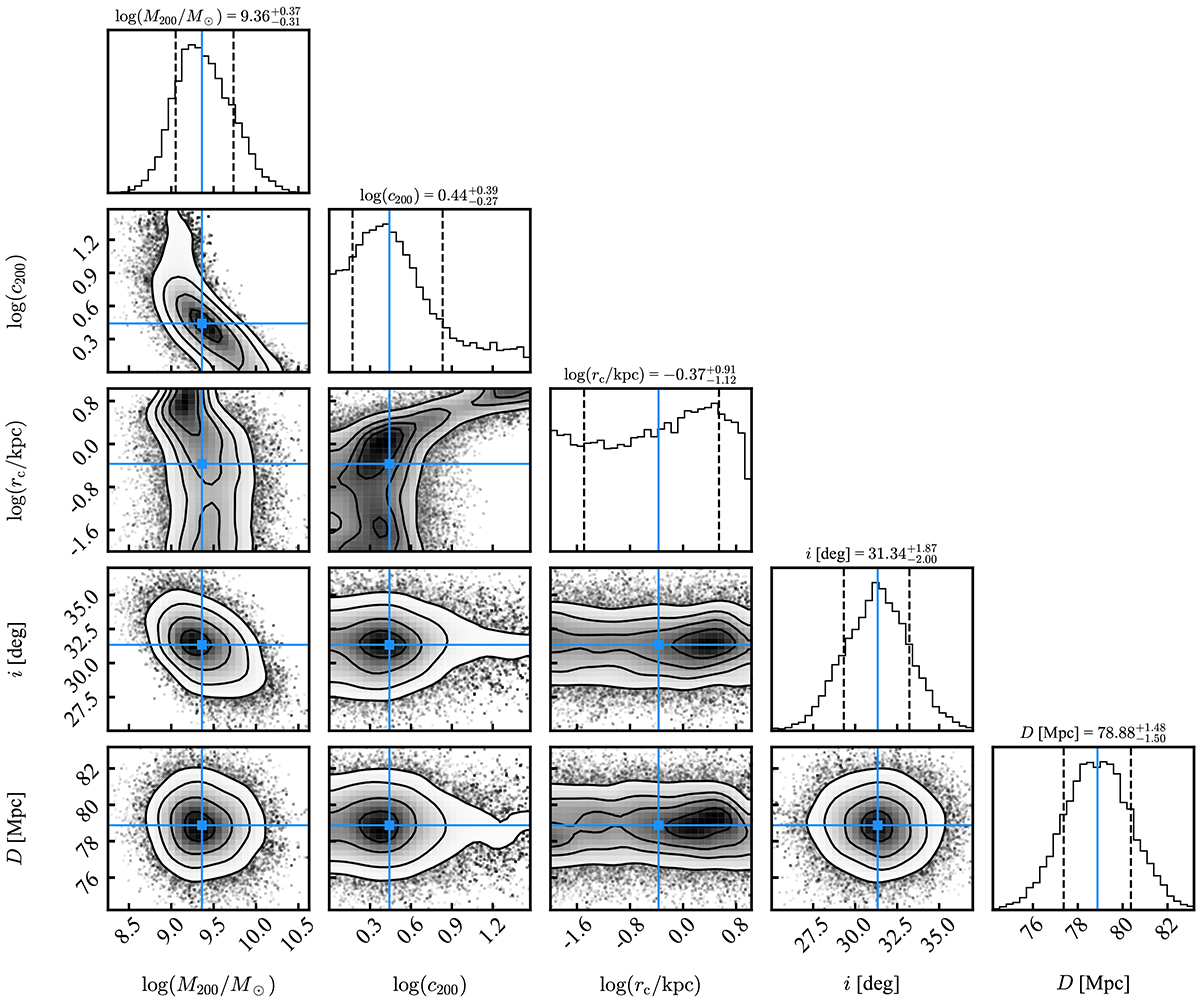
Fig. D.2.
Download original image
Posterior distributions of the CORENFW mass model shown in the top panel of Figure 9. The 50th percentiles of the distributions, corresponding to our adopted values, are shown in blue. The 16th and 84thpercentiles, corresponding to our uncertainties, are shown with black dashed curves.
Current usage metrics show cumulative count of Article Views (full-text article views including HTML views, PDF and ePub downloads, according to the available data) and Abstracts Views on Vision4Press platform.
Data correspond to usage on the plateform after 2015. The current usage metrics is available 48-96 hours after online publication and is updated daily on week days.
Initial download of the metrics may take a while.