Fig. 6.
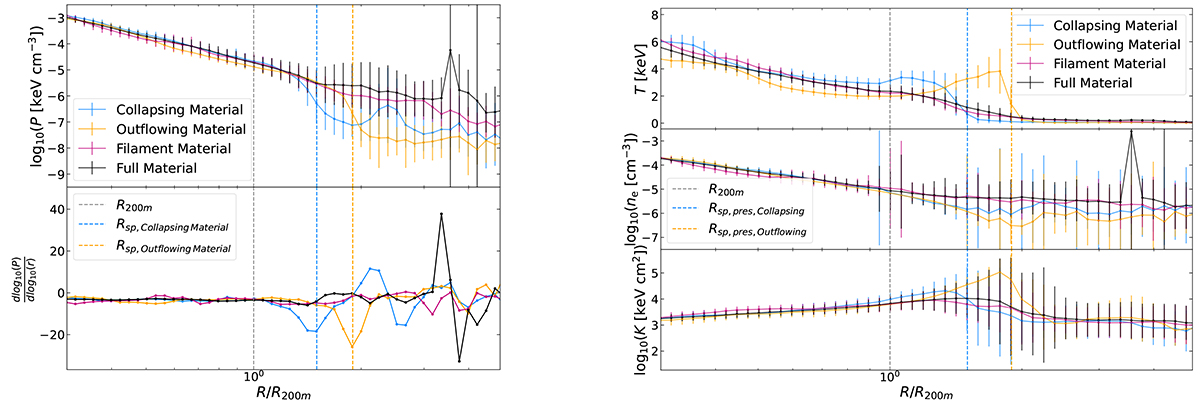
Download original image
Left: comparison of radial pressure profiles (top) and their gradient (bottom) in the selected regions and for the full material. Right: comparison of radial temperature (top), electron density (middle), and entropy (bottom) profiles also in the selected regions and for the full material. The colours stand for the same regions as for other figures: orange for the region of outflowing material, blue for the region of collapsing material, pink for the region of filament material, and black for the full material. Rsp,press identified with the pressure profile with the outflowing material and the collapsing material are shown by dashed vertical orange and blue lines. R200m is shown in grey. We observe that Rsp,gas < Rsp,press and that the minimum in the gradient corresponds to temperature and entropy peaks. Therefore, it might be an accretion shock rather than Rsp.
Current usage metrics show cumulative count of Article Views (full-text article views including HTML views, PDF and ePub downloads, according to the available data) and Abstracts Views on Vision4Press platform.
Data correspond to usage on the plateform after 2015. The current usage metrics is available 48-96 hours after online publication and is updated daily on week days.
Initial download of the metrics may take a while.