Fig. 4.
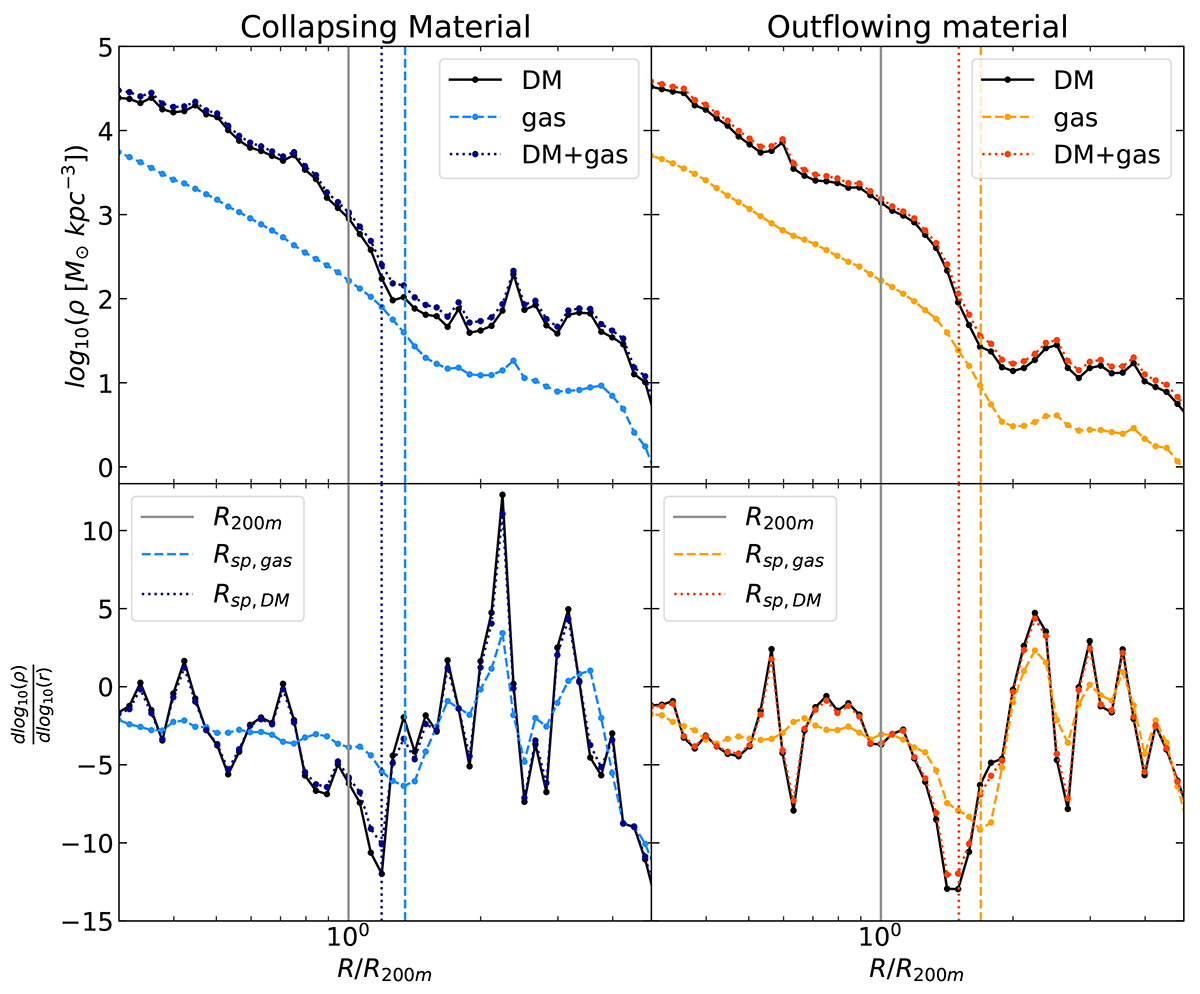
Download original image
Comparison of radial density profiles for the region of collapsing material (left) and the region of outflowing material (right). For both sides, the top panel is the density profile and the bottom panel is the gradient. The solid black profile is the DM, the dashed coloured profile (blue for collapsing material and orange for outflowing material) is the gas, and its dotted dark counterpart is the sum of DM and gas. Vertical dashed lines are R200m (grey), Rsp from gas (coloured), and DM (dark coloured). In each region, we observe that Rsp,DM < Rsp,gas. We also note that Rsp is smaller for both DM and gas in the region of collapsing material compared to the region of outflowing material.
Current usage metrics show cumulative count of Article Views (full-text article views including HTML views, PDF and ePub downloads, according to the available data) and Abstracts Views on Vision4Press platform.
Data correspond to usage on the plateform after 2015. The current usage metrics is available 48-96 hours after online publication and is updated daily on week days.
Initial download of the metrics may take a while.