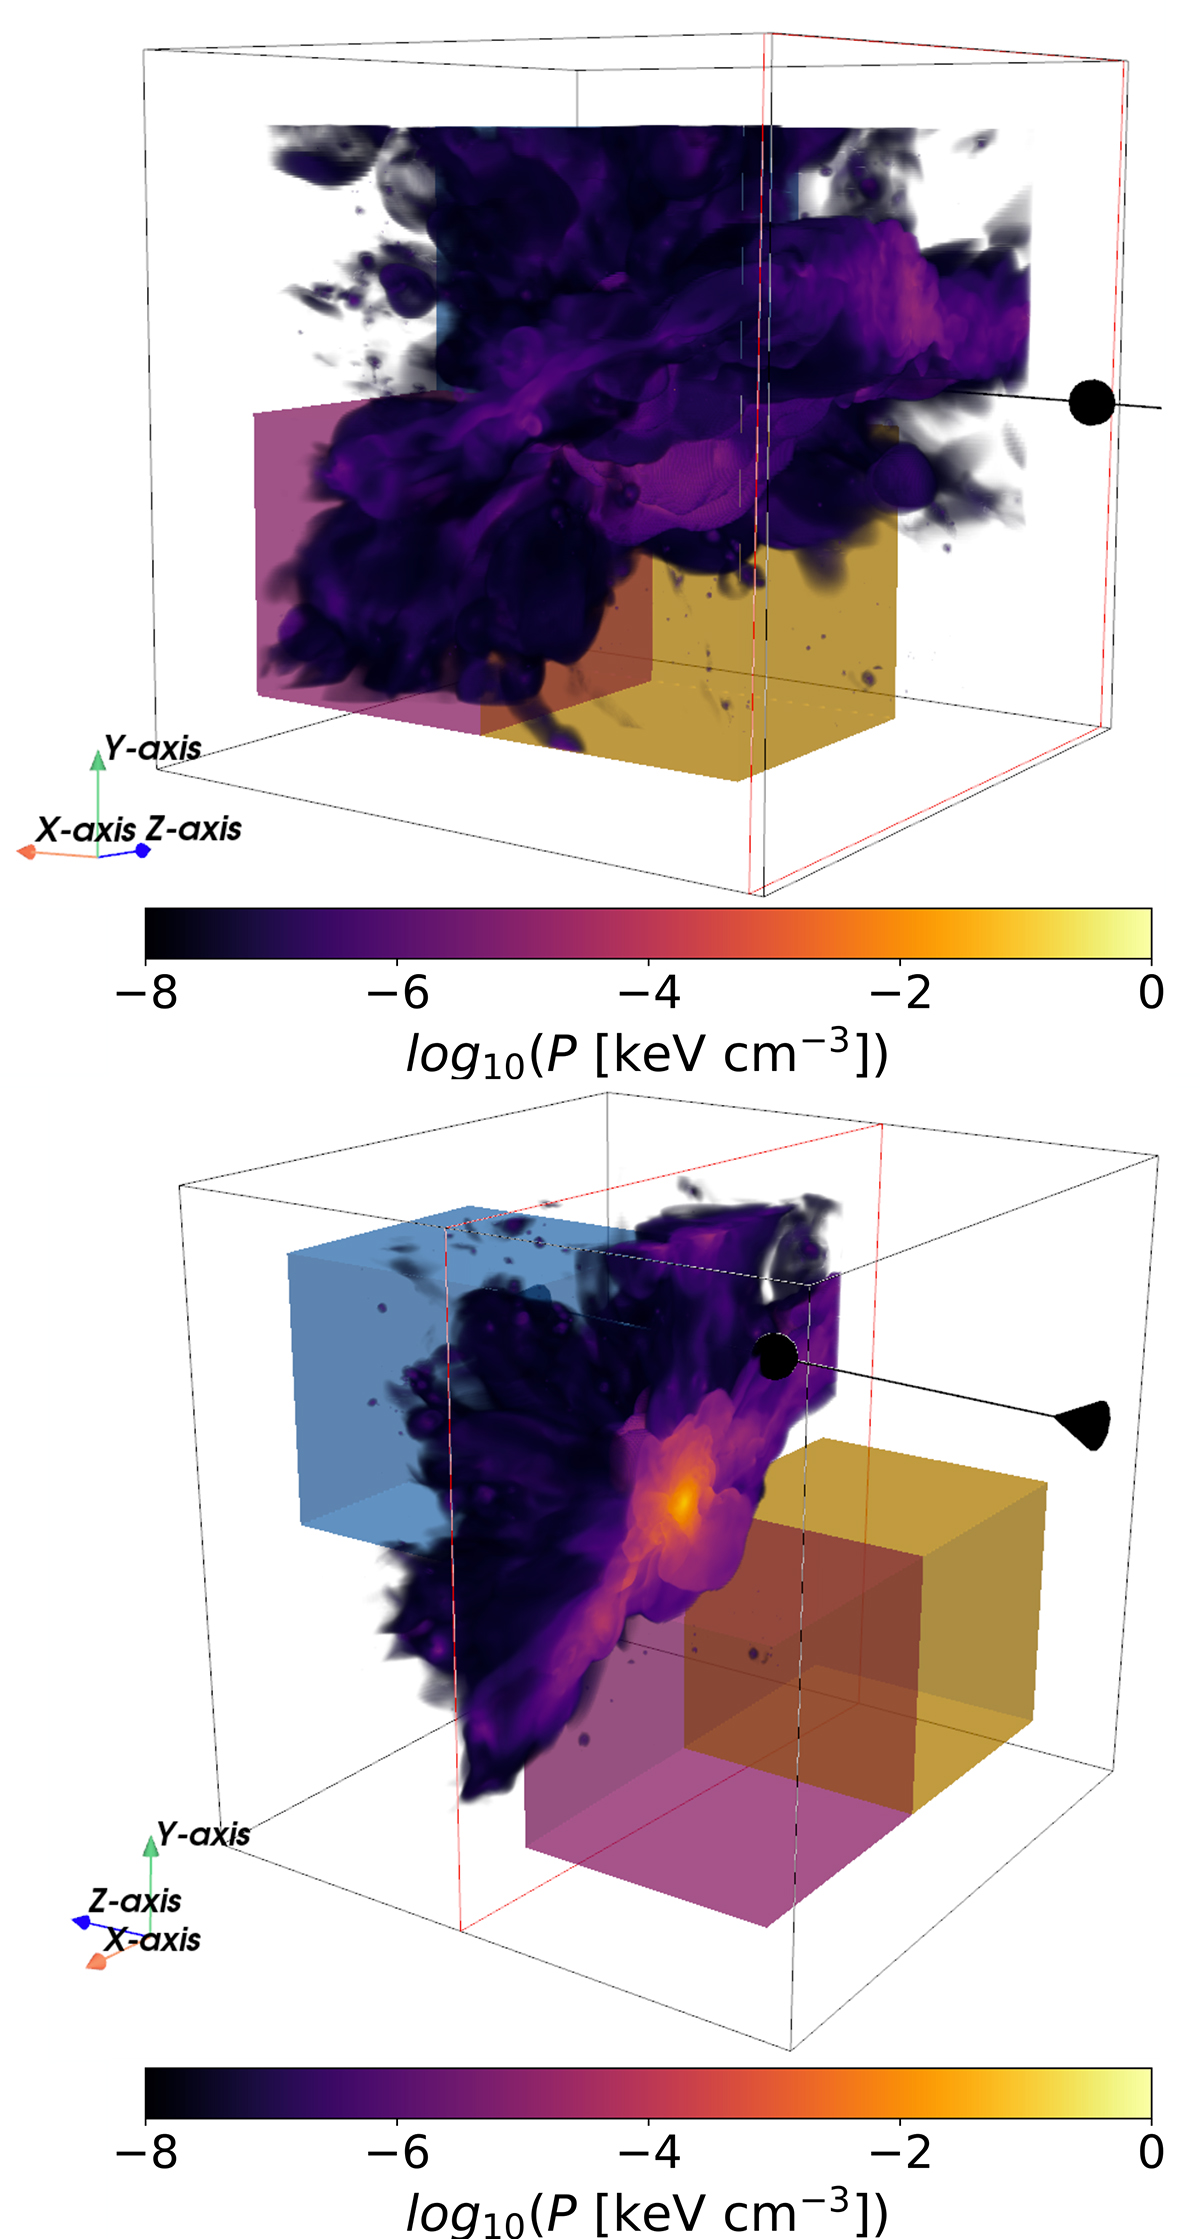
Fig. 2.
Download original image
3D visualisation of the pressure in the Virgo replica simulation. The pressure is in keV.cm−3 and is shown on a log scale in the range of [−8, 0]. The top panel shows the full box and the bottom panel shows a slice in the cluster’s core along the z axis. The orange sub-box is the region of outflowing material, the blue sub-box is the region of collapsing material, and the pink sub-box is the region of filament material.
Current usage metrics show cumulative count of Article Views (full-text article views including HTML views, PDF and ePub downloads, according to the available data) and Abstracts Views on Vision4Press platform.
Data correspond to usage on the plateform after 2015. The current usage metrics is available 48-96 hours after online publication and is updated daily on week days.
Initial download of the metrics may take a while.