Open Access
Fig. 7.
Download original image
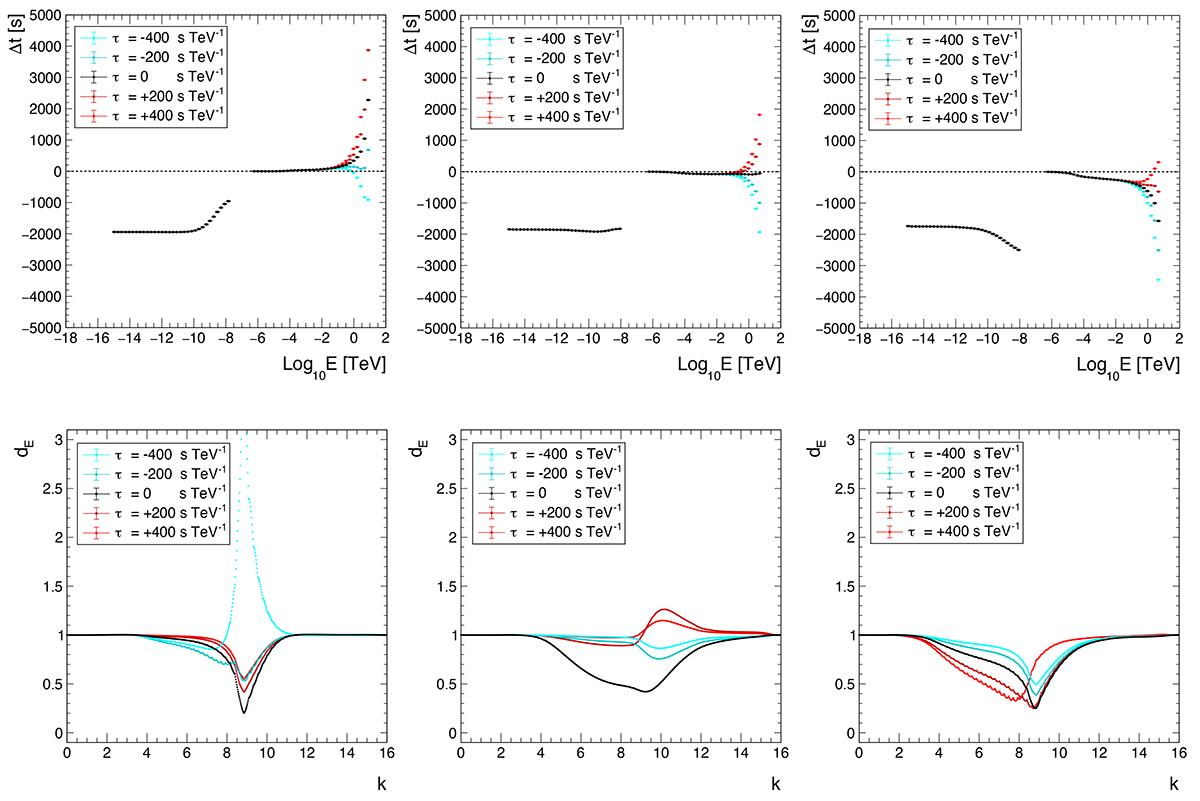
Time delays (upper panel) and Euclidean distance function (lower panel) computed for the three flares of Fig. 2 with various LIV contributions. The minimum Euclidean distance dE, min is always reached by the curve with no LIV effect (black). Left: increasing trend at τ = 0; centre: flat trend; right: decreasing trend.
Current usage metrics show cumulative count of Article Views (full-text article views including HTML views, PDF and ePub downloads, according to the available data) and Abstracts Views on Vision4Press platform.
Data correspond to usage on the plateform after 2015. The current usage metrics is available 48-96 hours after online publication and is updated daily on week days.
Initial download of the metrics may take a while.