Open Access
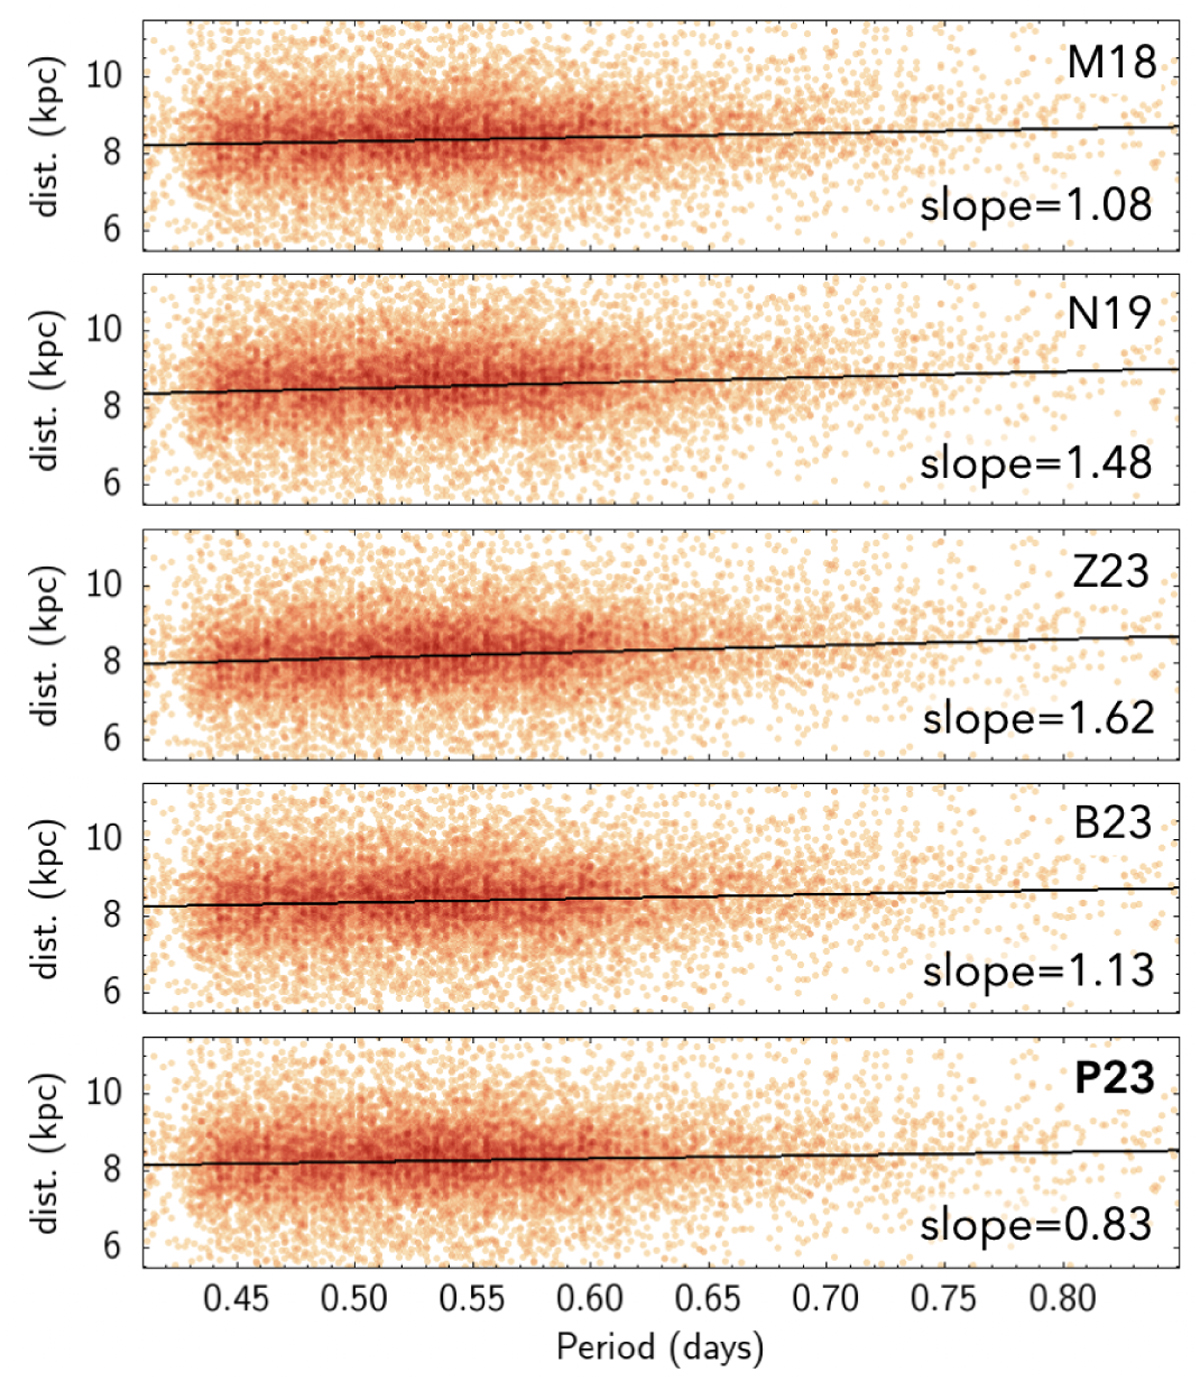
Fig. 8
Download original image
Same as Fig. 7, but now distances are plotted against period. A linear fit highlights the presence of a slope, that should not be there, whose value is written on the labels. The slope is smaller for the PLZ by Prudil et al. (2024), finally used in the present analysis.
Current usage metrics show cumulative count of Article Views (full-text article views including HTML views, PDF and ePub downloads, according to the available data) and Abstracts Views on Vision4Press platform.
Data correspond to usage on the plateform after 2015. The current usage metrics is available 48-96 hours after online publication and is updated daily on week days.
Initial download of the metrics may take a while.