Fig. 6
Download original image
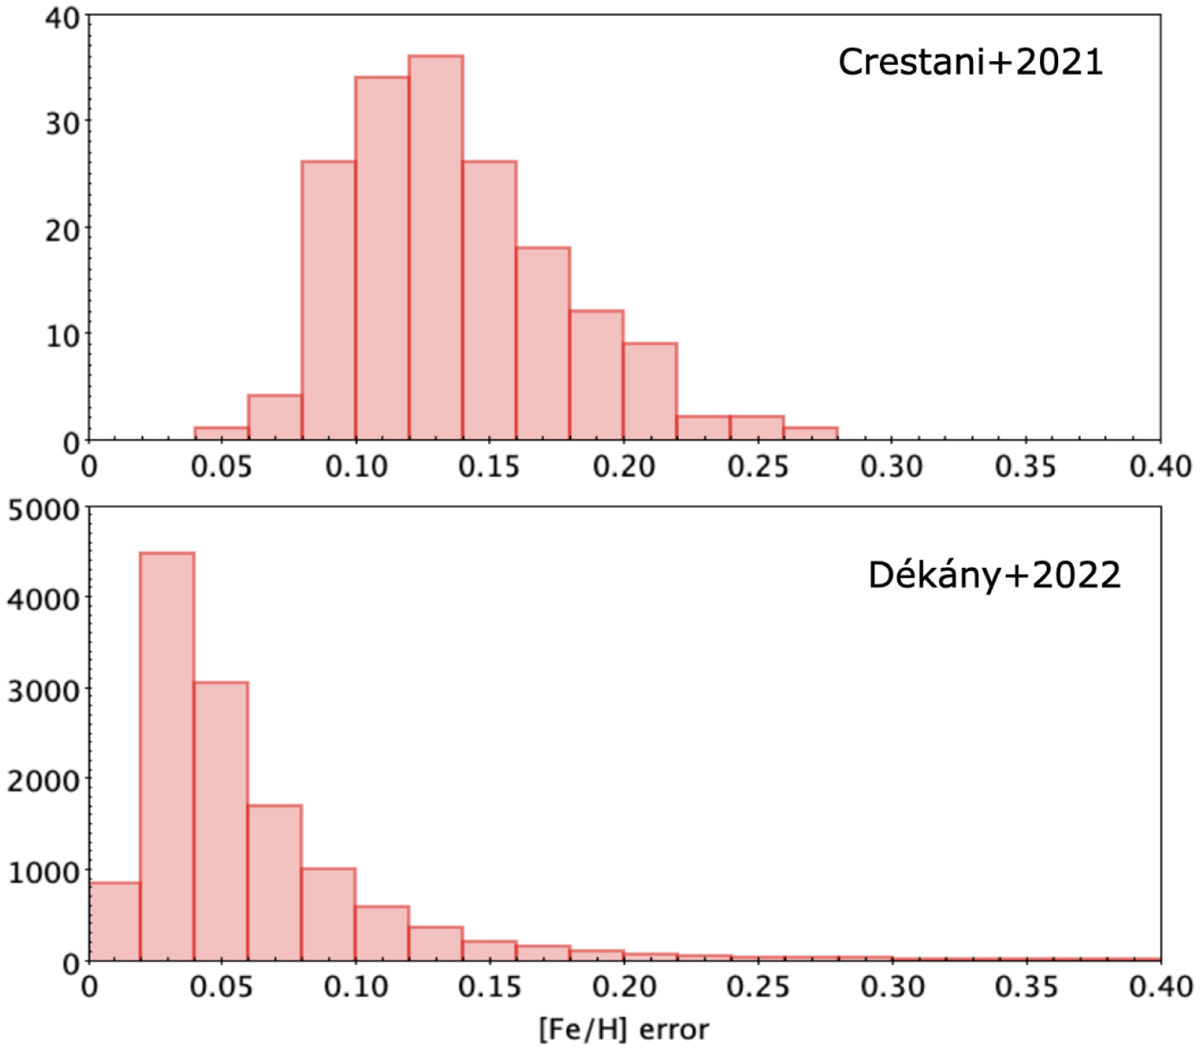
Top panel: distribution of the estimated errors in the [Fe/H] as quoted in Crestani et al. (2022, their Table 2). The latter work is based on high dispersion spectra (R=35 000) for 143 RRL. Bottom: distribution of the estimated errors in the photometric [Fe/H] values inferred by Dékány & Grebel (2022). Photometric [Fe/H] values are inferred from the shape of the light curve, by means of a machine learning algorithm trained (indirectly) on the spectroscopic measurements by Crestani et al. (2022).
Current usage metrics show cumulative count of Article Views (full-text article views including HTML views, PDF and ePub downloads, according to the available data) and Abstracts Views on Vision4Press platform.
Data correspond to usage on the plateform after 2015. The current usage metrics is available 48-96 hours after online publication and is updated daily on week days.
Initial download of the metrics may take a while.