Fig. A.1
Download original image
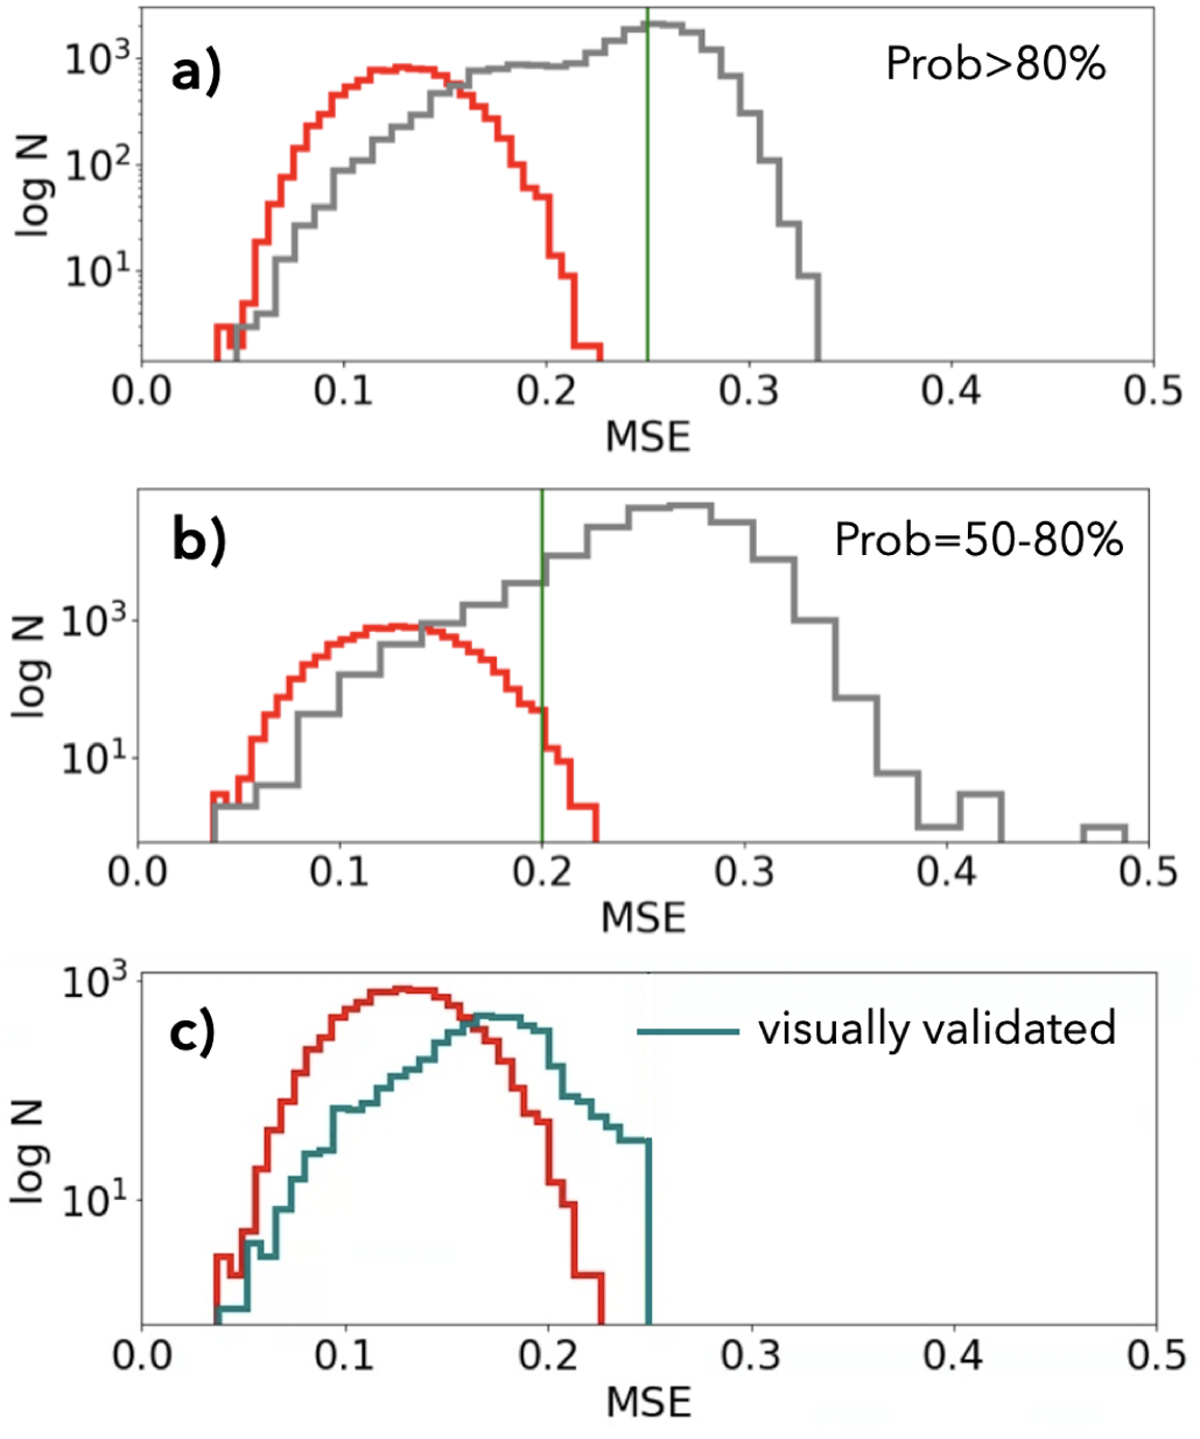
Distribution of MSE for three subsample of our catalogue. The panels show that the selection of candidates with Prob>80% and MSE<0.25 (top) or Prob=50–80% and MSE<0.2 (middle) allows us to isolate a sub-sample occupying the same parameter space of the golden sample with Prob>90% and S/N>60, here shown in red, that we use as a reference. The bottom panel shows the final sample resulting from the visual inspection (teal) compared with the reference sample (red).
Current usage metrics show cumulative count of Article Views (full-text article views including HTML views, PDF and ePub downloads, according to the available data) and Abstracts Views on Vision4Press platform.
Data correspond to usage on the plateform after 2015. The current usage metrics is available 48-96 hours after online publication and is updated daily on week days.
Initial download of the metrics may take a while.