Fig. 15
Download original image
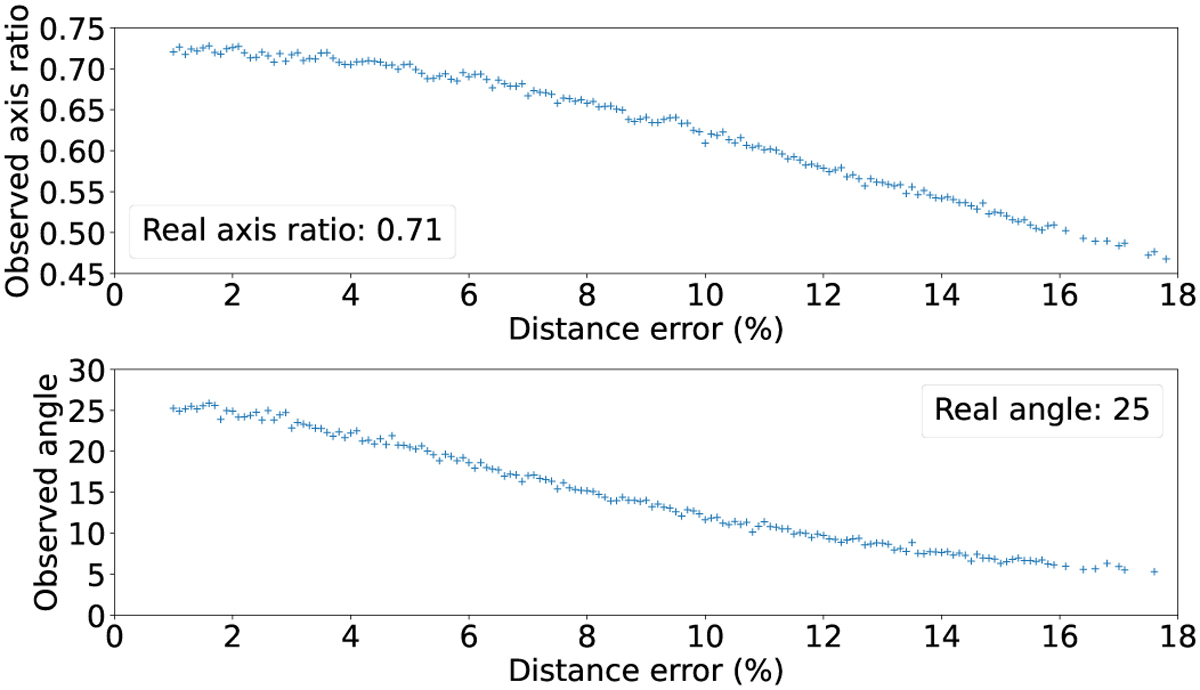
Observed axis ratio (top) and inclination angle (bottom) as a function of the percent error on the distance for a fixed input value of both parameters, as indicated by the labels. The simulation shows that at larger distance errors, the observed bar is more elongated than its true counterpart, and its observed major axis tends to align with the Sun-GC direction.
Current usage metrics show cumulative count of Article Views (full-text article views including HTML views, PDF and ePub downloads, according to the available data) and Abstracts Views on Vision4Press platform.
Data correspond to usage on the plateform after 2015. The current usage metrics is available 48-96 hours after online publication and is updated daily on week days.
Initial download of the metrics may take a while.