Fig. 10
Download original image
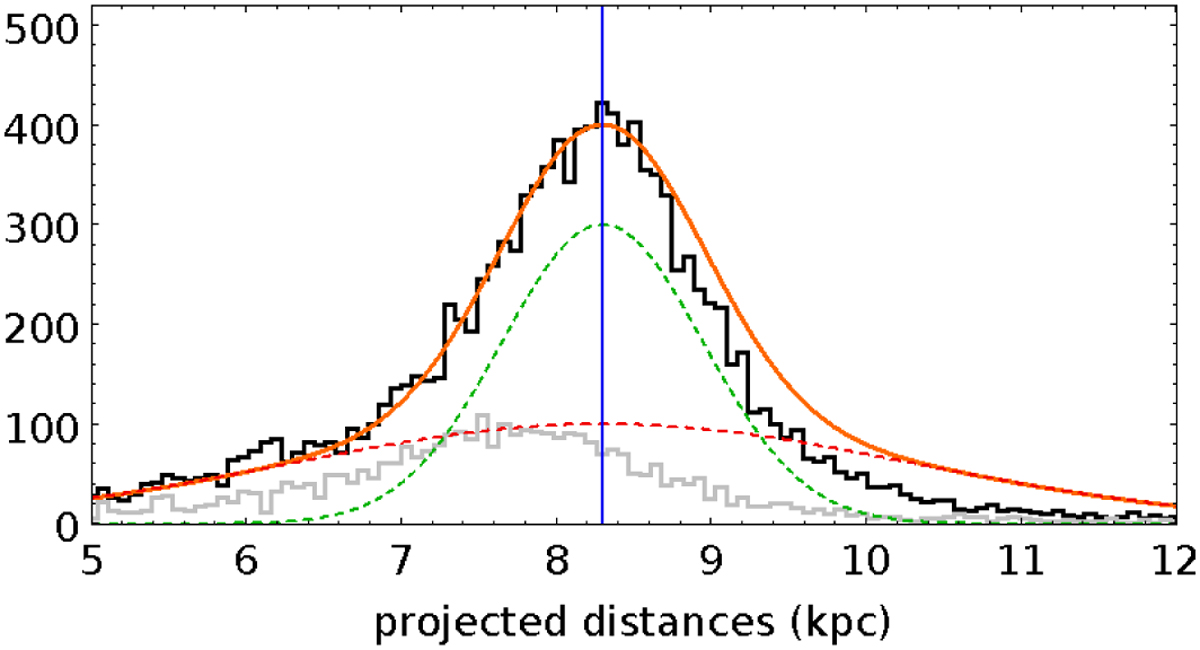
Histogram of the distances to individual variables, projected along the Sun-GC direction. The black histogram shows the 12 965 variables identified by our algorithm, while the light gray histogram shows the 3521 RRab that were added from the OGLE-IV catalog. The latter have a clear bias toward more nearby variables, and therefore, they are excluded from the analysis. The green dotted Gaussian represents the projected bulge density distribution, while the red dotted one refers to the disk. Their sum, reproducing the observed distribution, is the orange thick line. The latter is centered at RGC=8.30 kpc (blue vertical line).
Current usage metrics show cumulative count of Article Views (full-text article views including HTML views, PDF and ePub downloads, according to the available data) and Abstracts Views on Vision4Press platform.
Data correspond to usage on the plateform after 2015. The current usage metrics is available 48-96 hours after online publication and is updated daily on week days.
Initial download of the metrics may take a while.