Fig. 8.
Download original image
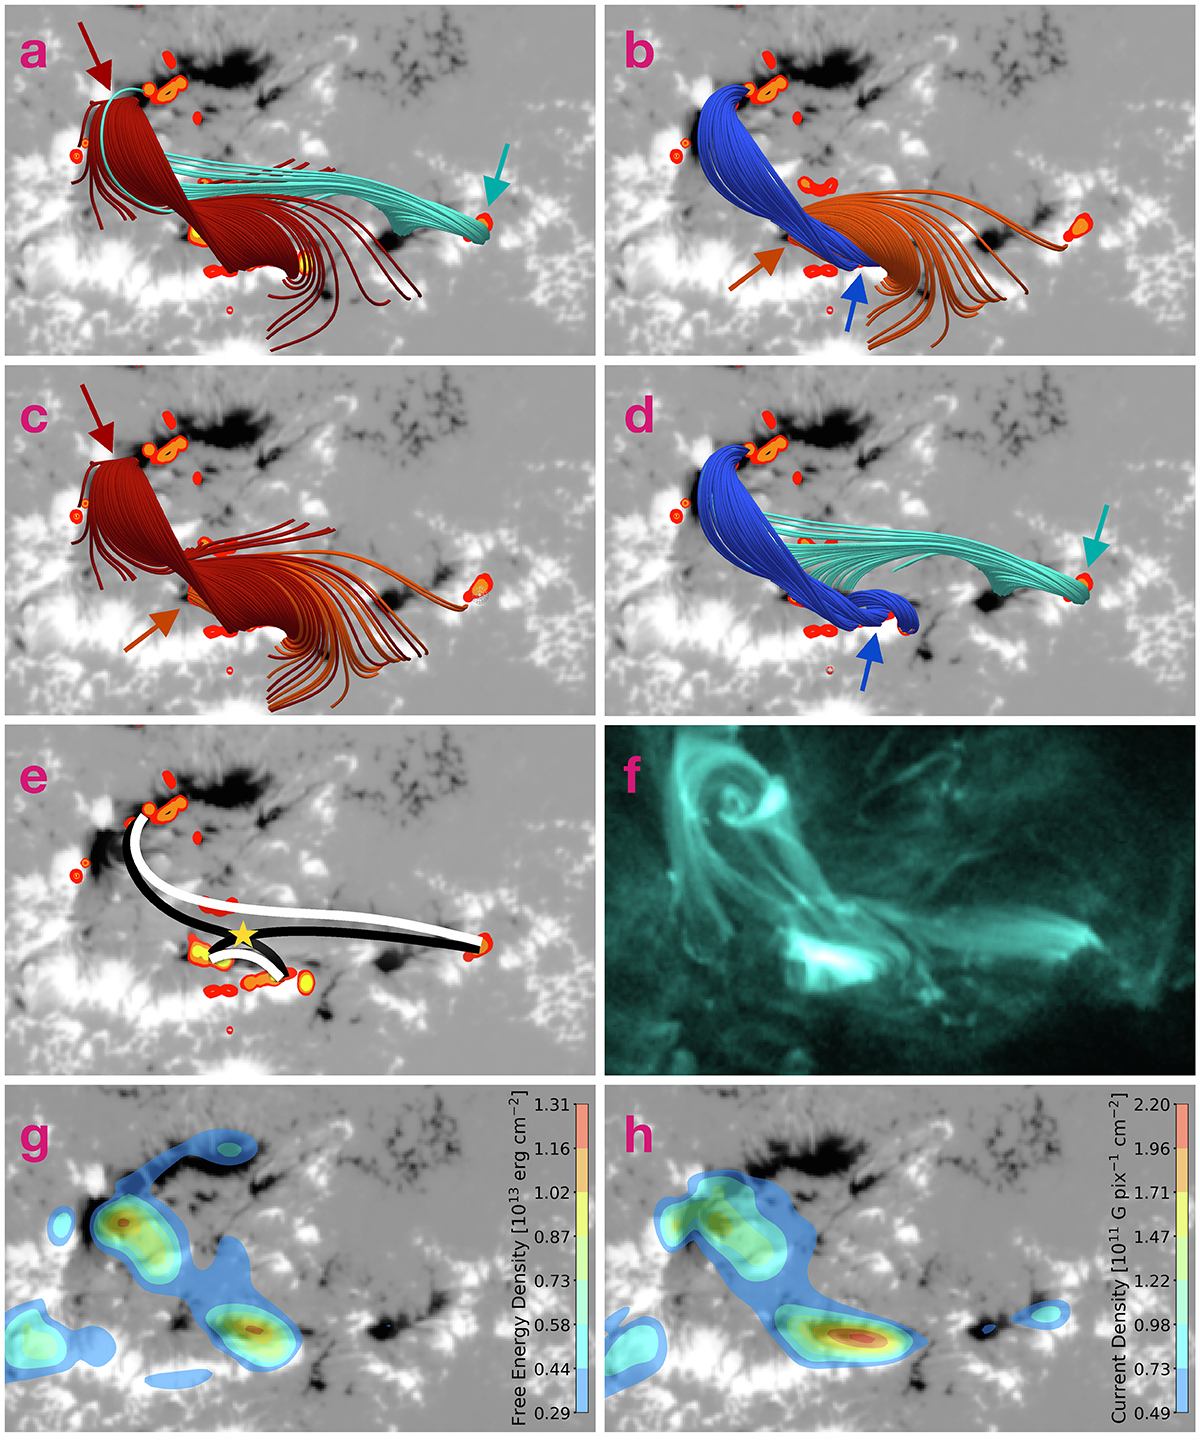
Overview of the proposed reconnection scenario. Panels a–d: pairs of field structures starting from four relevant regions: The flare ribbons in the major positive and minor negative polarity regions and the kernels in the major negative and western positive polarity regions. The arrows indicate the region of the seed source for starting the field lines of the corresponding color. Panel e: illustration of the proposed reconnection scenario. Black field lines represent field lines from the pre-flare configuration that were reconnected to form the white field lines during the flare. The reconnection region is indicated by the yellow star. Panel f: AIA 131 Å image taken during the peak of the flare at 09:56 UT. Panel g: filled contours of the vertically integrated free energy density during the flare (09:58 UT). Panel h: filled contours of the vertically integrated current density during the flare (09:58 UT).
Current usage metrics show cumulative count of Article Views (full-text article views including HTML views, PDF and ePub downloads, according to the available data) and Abstracts Views on Vision4Press platform.
Data correspond to usage on the plateform after 2015. The current usage metrics is available 48-96 hours after online publication and is updated daily on week days.
Initial download of the metrics may take a while.