Fig. 4.
Download original image
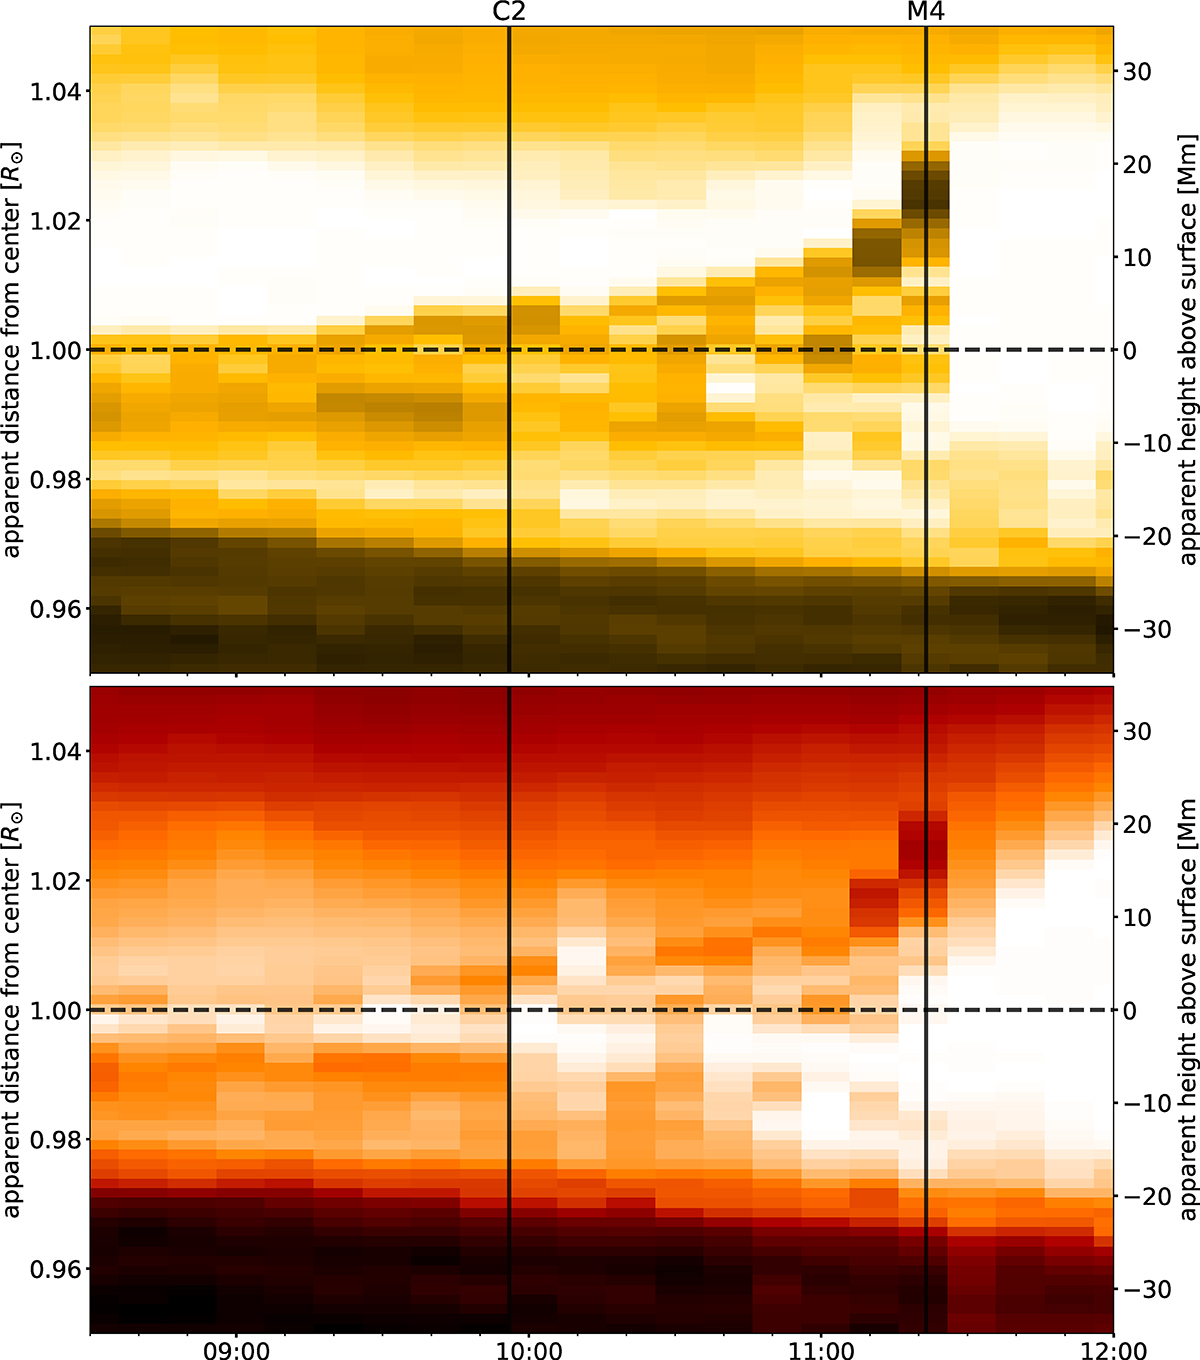
Evolution of the intensity profile sampled along the marked line in Fig. 3. The times of the peak 15–25 keV HXR flux during the C2 flare and of the first major HXR burst during the M4 flare are marked.
Current usage metrics show cumulative count of Article Views (full-text article views including HTML views, PDF and ePub downloads, according to the available data) and Abstracts Views on Vision4Press platform.
Data correspond to usage on the plateform after 2015. The current usage metrics is available 48-96 hours after online publication and is updated daily on week days.
Initial download of the metrics may take a while.