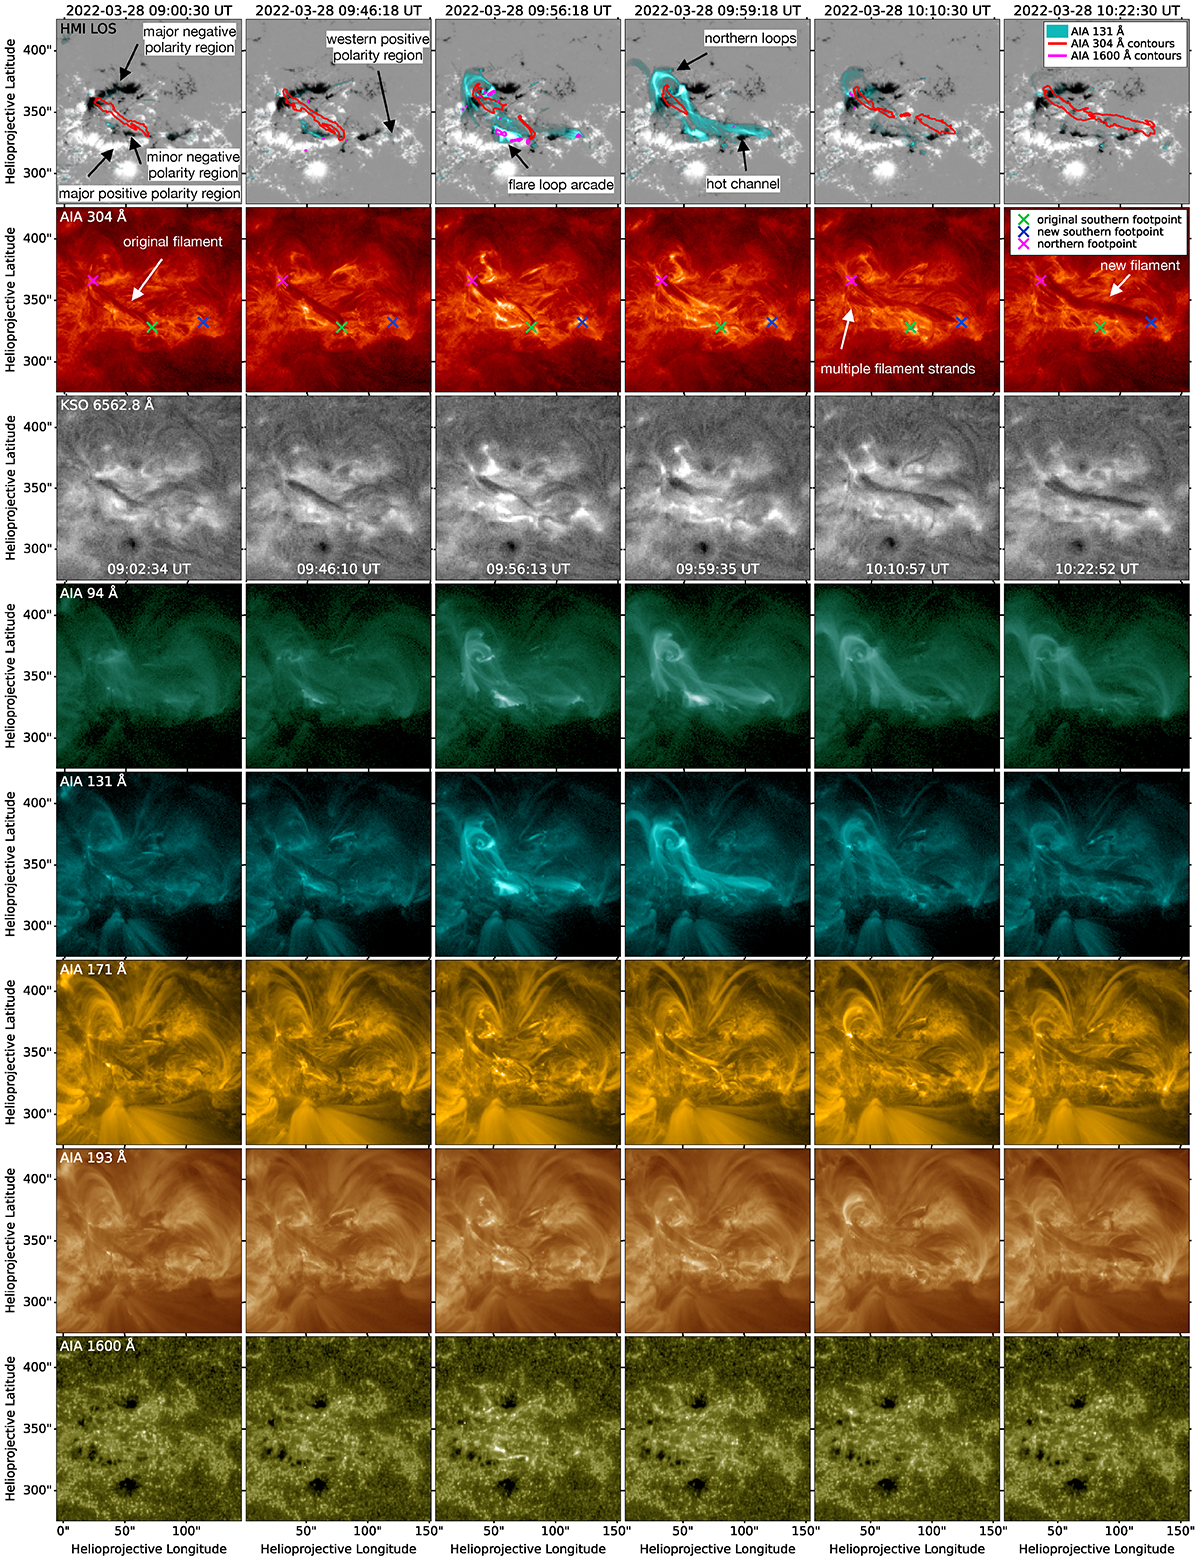
Fig. 2.
Download original image
Evolution of the filament as observed by selected SDO/AIA channels and by KSO in Hα at six times (columns). Top row: AIA 131 Å images, filament contours extracted from the AIA 304 Å channel, and AIA 1600 Å contours overlayed on HMI LOS magnetograms, scaled to ±1000 G. The positions of the filament footpoints are marked on the AIA 304 Å images. The associated movie is available online.
Current usage metrics show cumulative count of Article Views (full-text article views including HTML views, PDF and ePub downloads, according to the available data) and Abstracts Views on Vision4Press platform.
Data correspond to usage on the plateform after 2015. The current usage metrics is available 48-96 hours after online publication and is updated daily on week days.
Initial download of the metrics may take a while.