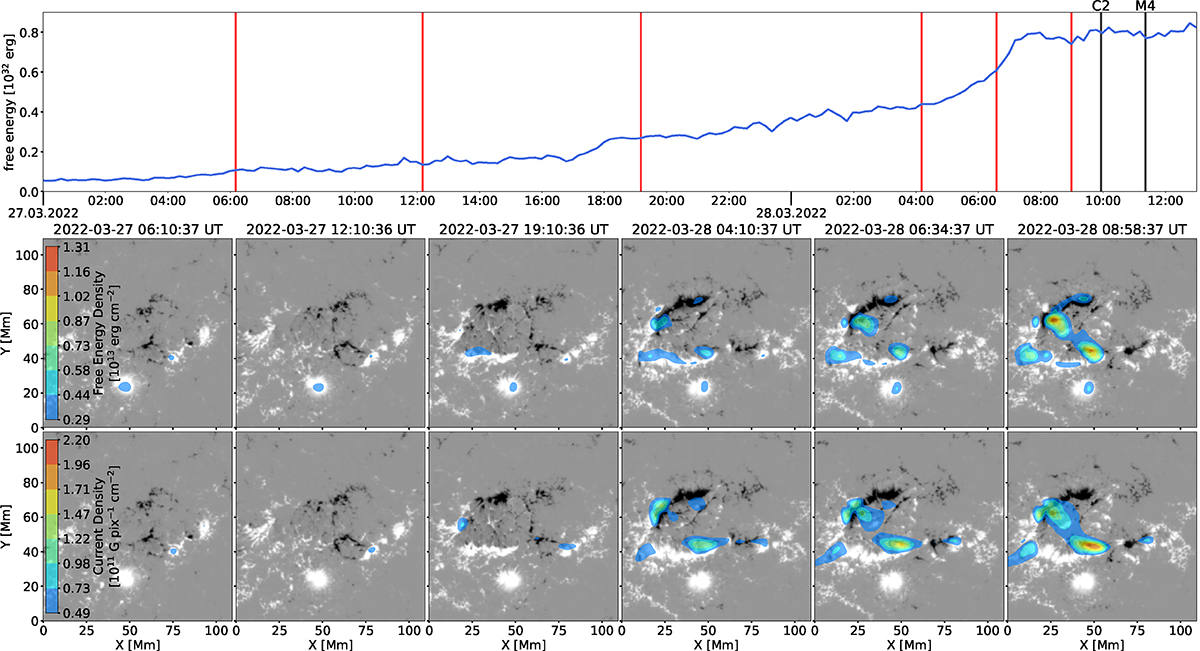
Fig. 11.
Download original image
Evolution of free magnetic energy and current density during the formation of AR 12975 and the original filament. The top panel shows the time evolution of the total free magnetic energy in the submaps shown below, with their observation times marked with red lines. The peak times of the C2 and M4 flares are marked with black lines. The submaps in the bottom two rows show the HMI magnetogram in CEA projection scaled to ±1000 G and overplotted with filled contours of either the free magnetic energy density (middle row) or the current density (bottom row) integrated along the z-axis. The associated movie is available online.
Current usage metrics show cumulative count of Article Views (full-text article views including HTML views, PDF and ePub downloads, according to the available data) and Abstracts Views on Vision4Press platform.
Data correspond to usage on the plateform after 2015. The current usage metrics is available 48-96 hours after online publication and is updated daily on week days.
Initial download of the metrics may take a while.