Fig. 9
Download original image
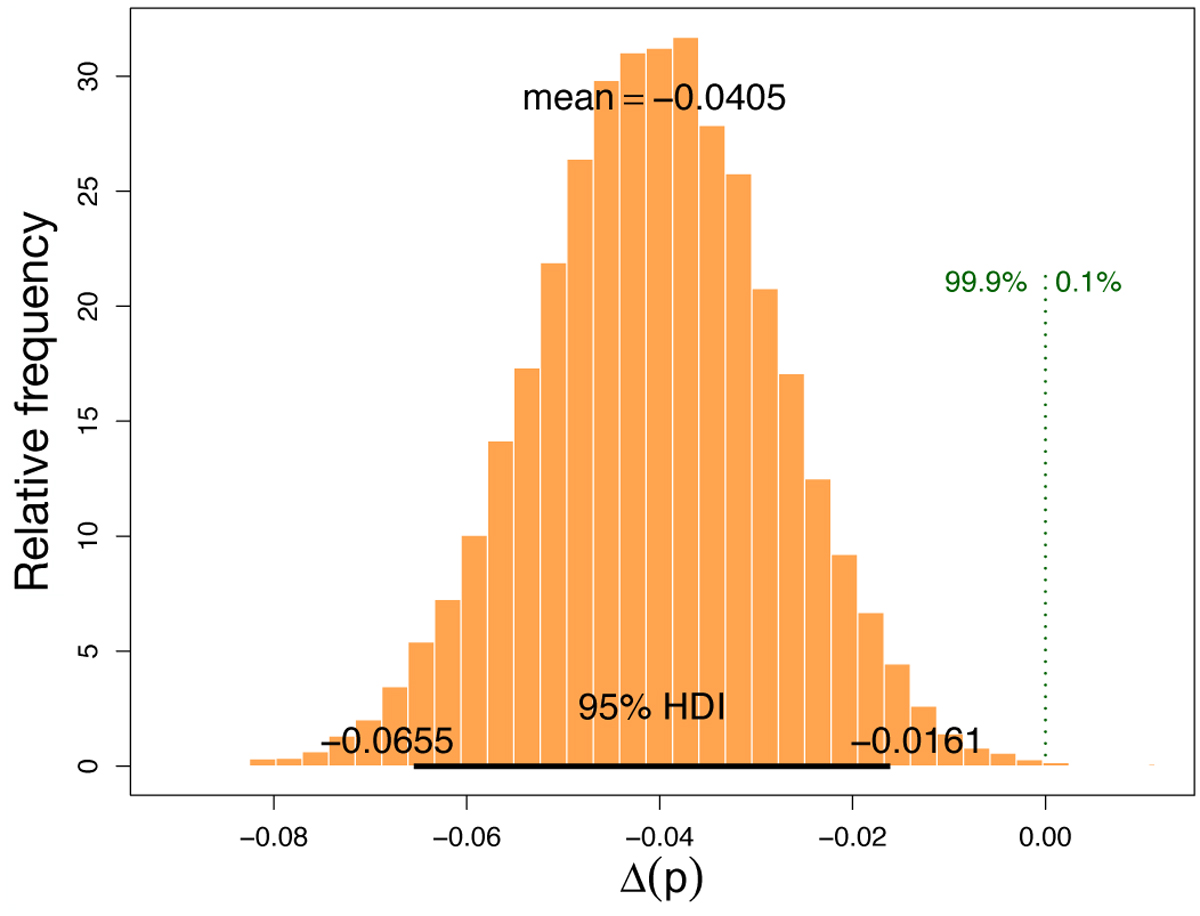
Posterior probability distribution for the difference in the mean p parameter of the beta distributions fitted to the eccentricity distributions of planetary orbits in simple and multiple stars. Here ∆p = psingle − pmultiple, and θsingle = θmultiple. The thick horizontal black line represents the 95% HDI (see text), while the black labels indicate the upper and lower values of the 95% HDI and the mean ∆p. The vertical green dotted line indicates the location of the null difference, while the percentages show the relative areas of the distribution at both sides of this line. This figure was created using a modified version of the software provided by Kruschke (2015).
Current usage metrics show cumulative count of Article Views (full-text article views including HTML views, PDF and ePub downloads, according to the available data) and Abstracts Views on Vision4Press platform.
Data correspond to usage on the plateform after 2015. The current usage metrics is available 48-96 hours after online publication and is updated daily on week days.
Initial download of the metrics may take a while.