Open Access
Fig. 14
Download original image
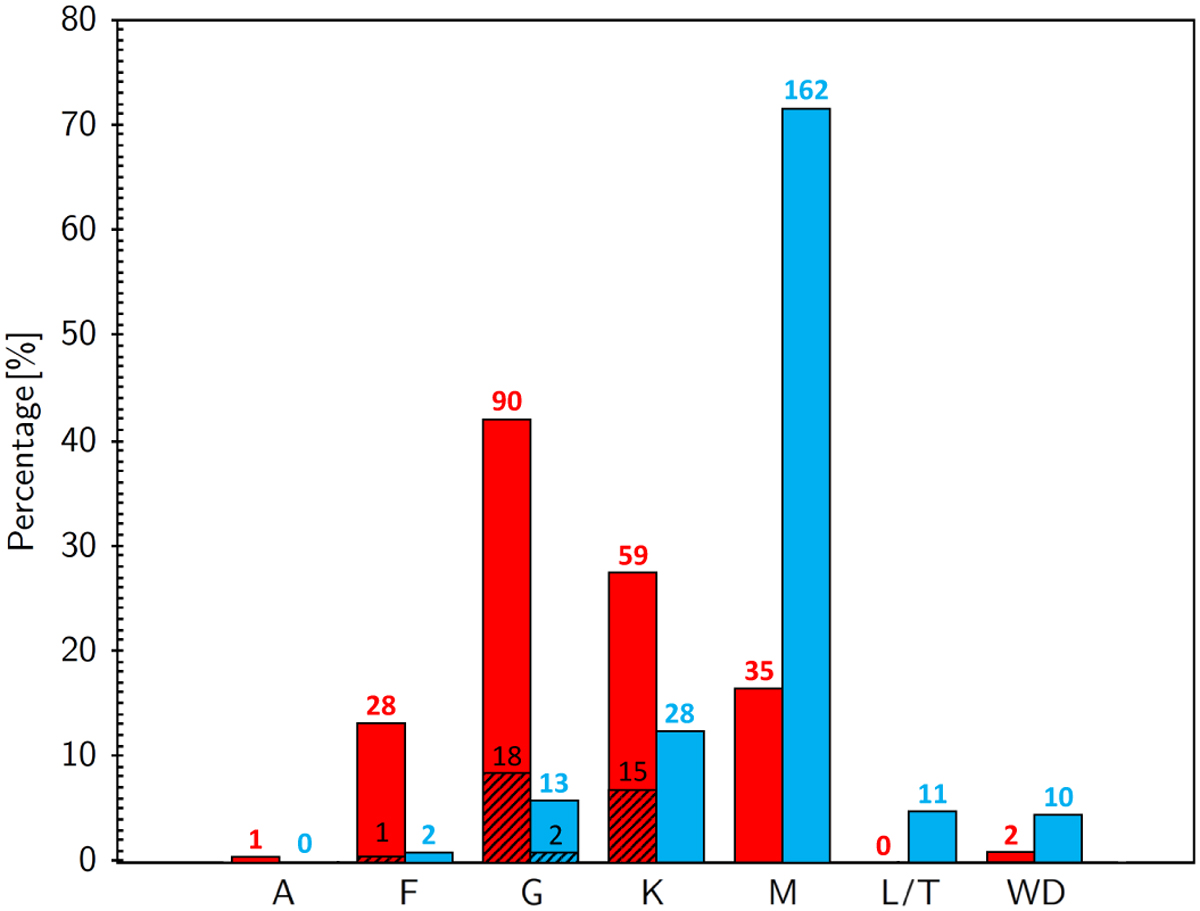
Relative distribution of host stars (red) and companion stars (blue) per spectral type. Each bar is labelled with the absolute number of stars per bin. The black stripped area represents the number of subgiant and giant stars in each spectral type. Compare with Fig. 3 of Fontanive & Bardalez Gagliuffi (2021).
Current usage metrics show cumulative count of Article Views (full-text article views including HTML views, PDF and ePub downloads, according to the available data) and Abstracts Views on Vision4Press platform.
Data correspond to usage on the plateform after 2015. The current usage metrics is available 48-96 hours after online publication and is updated daily on week days.
Initial download of the metrics may take a while.