Fig. 12
Download original image
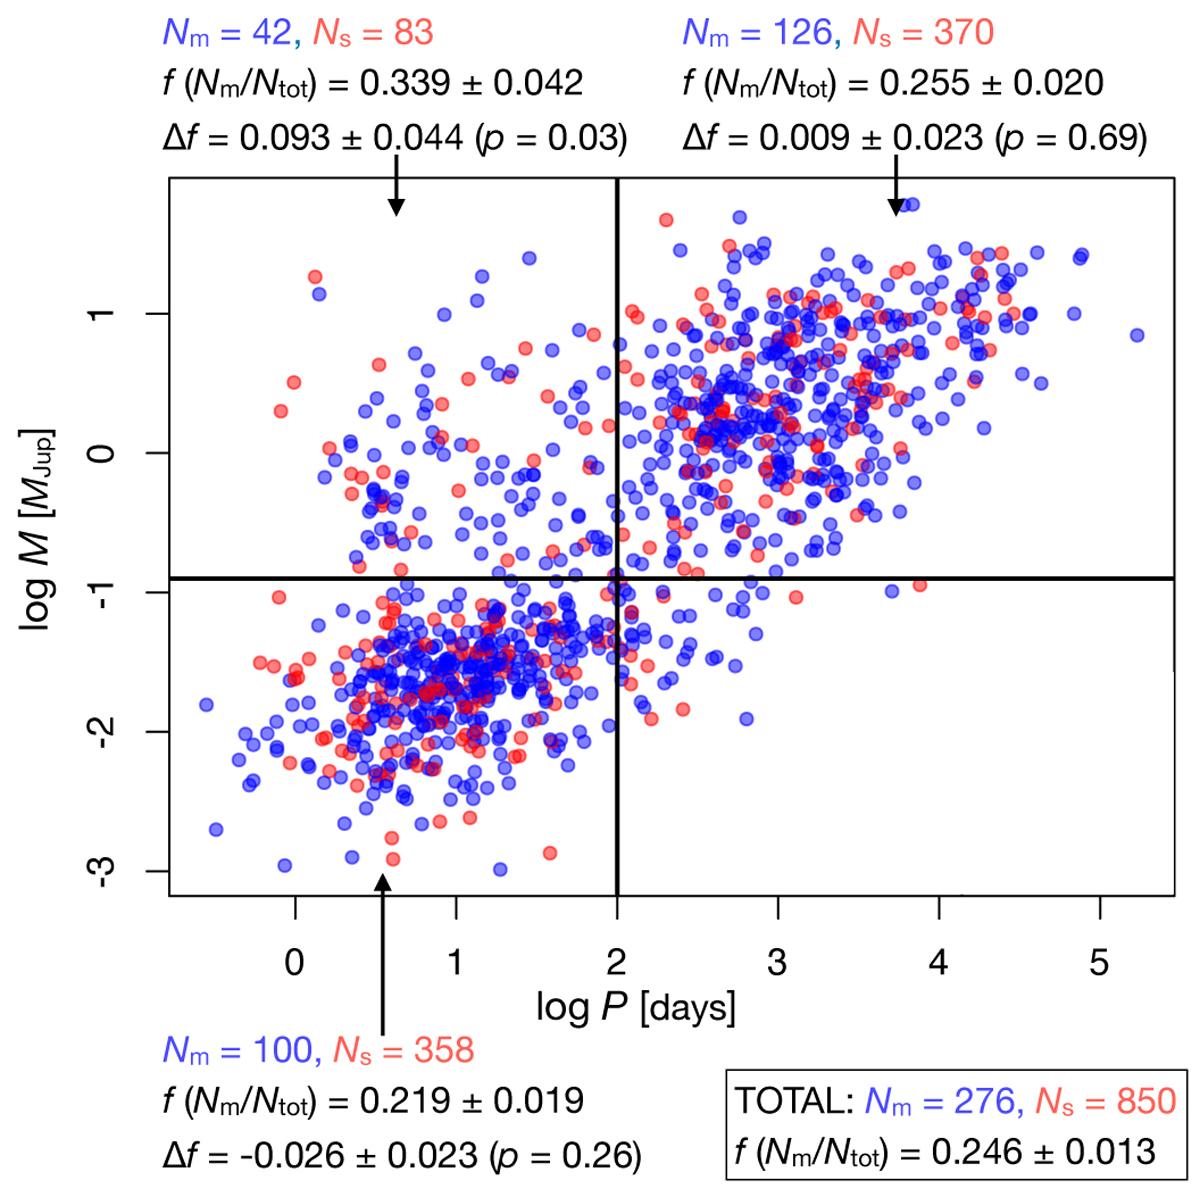
Period-mass diagram for planets in single (red circles) and multiple systems (blue circles). The horizontal black line divides the sample into high- and low-mass regimes using a cutoff of 0.1258 MJup (40 M⊕), while the vertical black line at P = 100 d marks the position of the arithmetic mean of the distribution in orbital periods. The information showed for each quadrant is the number of planets in multiple, Nm, and single systems, Ns, the fraction of planets in multiple systems with respect to the whole sample, f = Nm/(Nm + Ns), the difference ∆ƒ between this ratio and the value computed for the total sample (ftot = 0.246), and, in parenthesis, the statistical significance p of the differences. No information is offered for the bottom-right quadrant due to the insufficient number of planets.
Current usage metrics show cumulative count of Article Views (full-text article views including HTML views, PDF and ePub downloads, according to the available data) and Abstracts Views on Vision4Press platform.
Data correspond to usage on the plateform after 2015. The current usage metrics is available 48-96 hours after online publication and is updated daily on week days.
Initial download of the metrics may take a while.