Fig. 10
Download original image
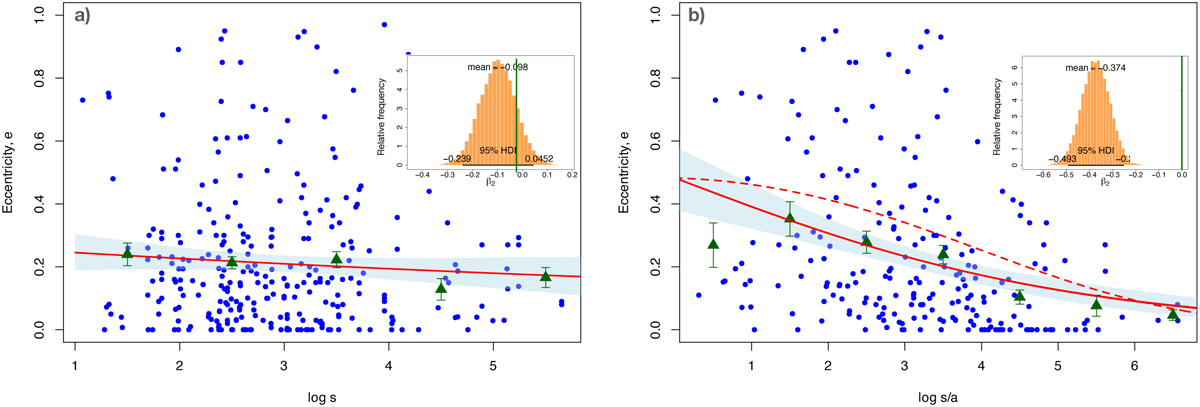
Planet eccentricity as a function of star-star separation (panel a, left, in au) and of ratio between star-star separation and semi-major axis (panel b, right). The red lines show the predicted mean value p of the beta distributions as a function of the dependent variable, in logarithmic scale. The blue shades around these lines correspond to their 95% HDI. The insets show the corresponding posterior probability distribution of the β2 parameters, and the vertical green lines mark β2 = 0. Green triangles mark the mean eccentricities in bins of 1 dex, together with error bars for their formal errors. The dashed red line in panel b shows the result of a generalised model using a quadratic fit.
Current usage metrics show cumulative count of Article Views (full-text article views including HTML views, PDF and ePub downloads, according to the available data) and Abstracts Views on Vision4Press platform.
Data correspond to usage on the plateform after 2015. The current usage metrics is available 48-96 hours after online publication and is updated daily on week days.
Initial download of the metrics may take a while.