Fig. 5
Download original image
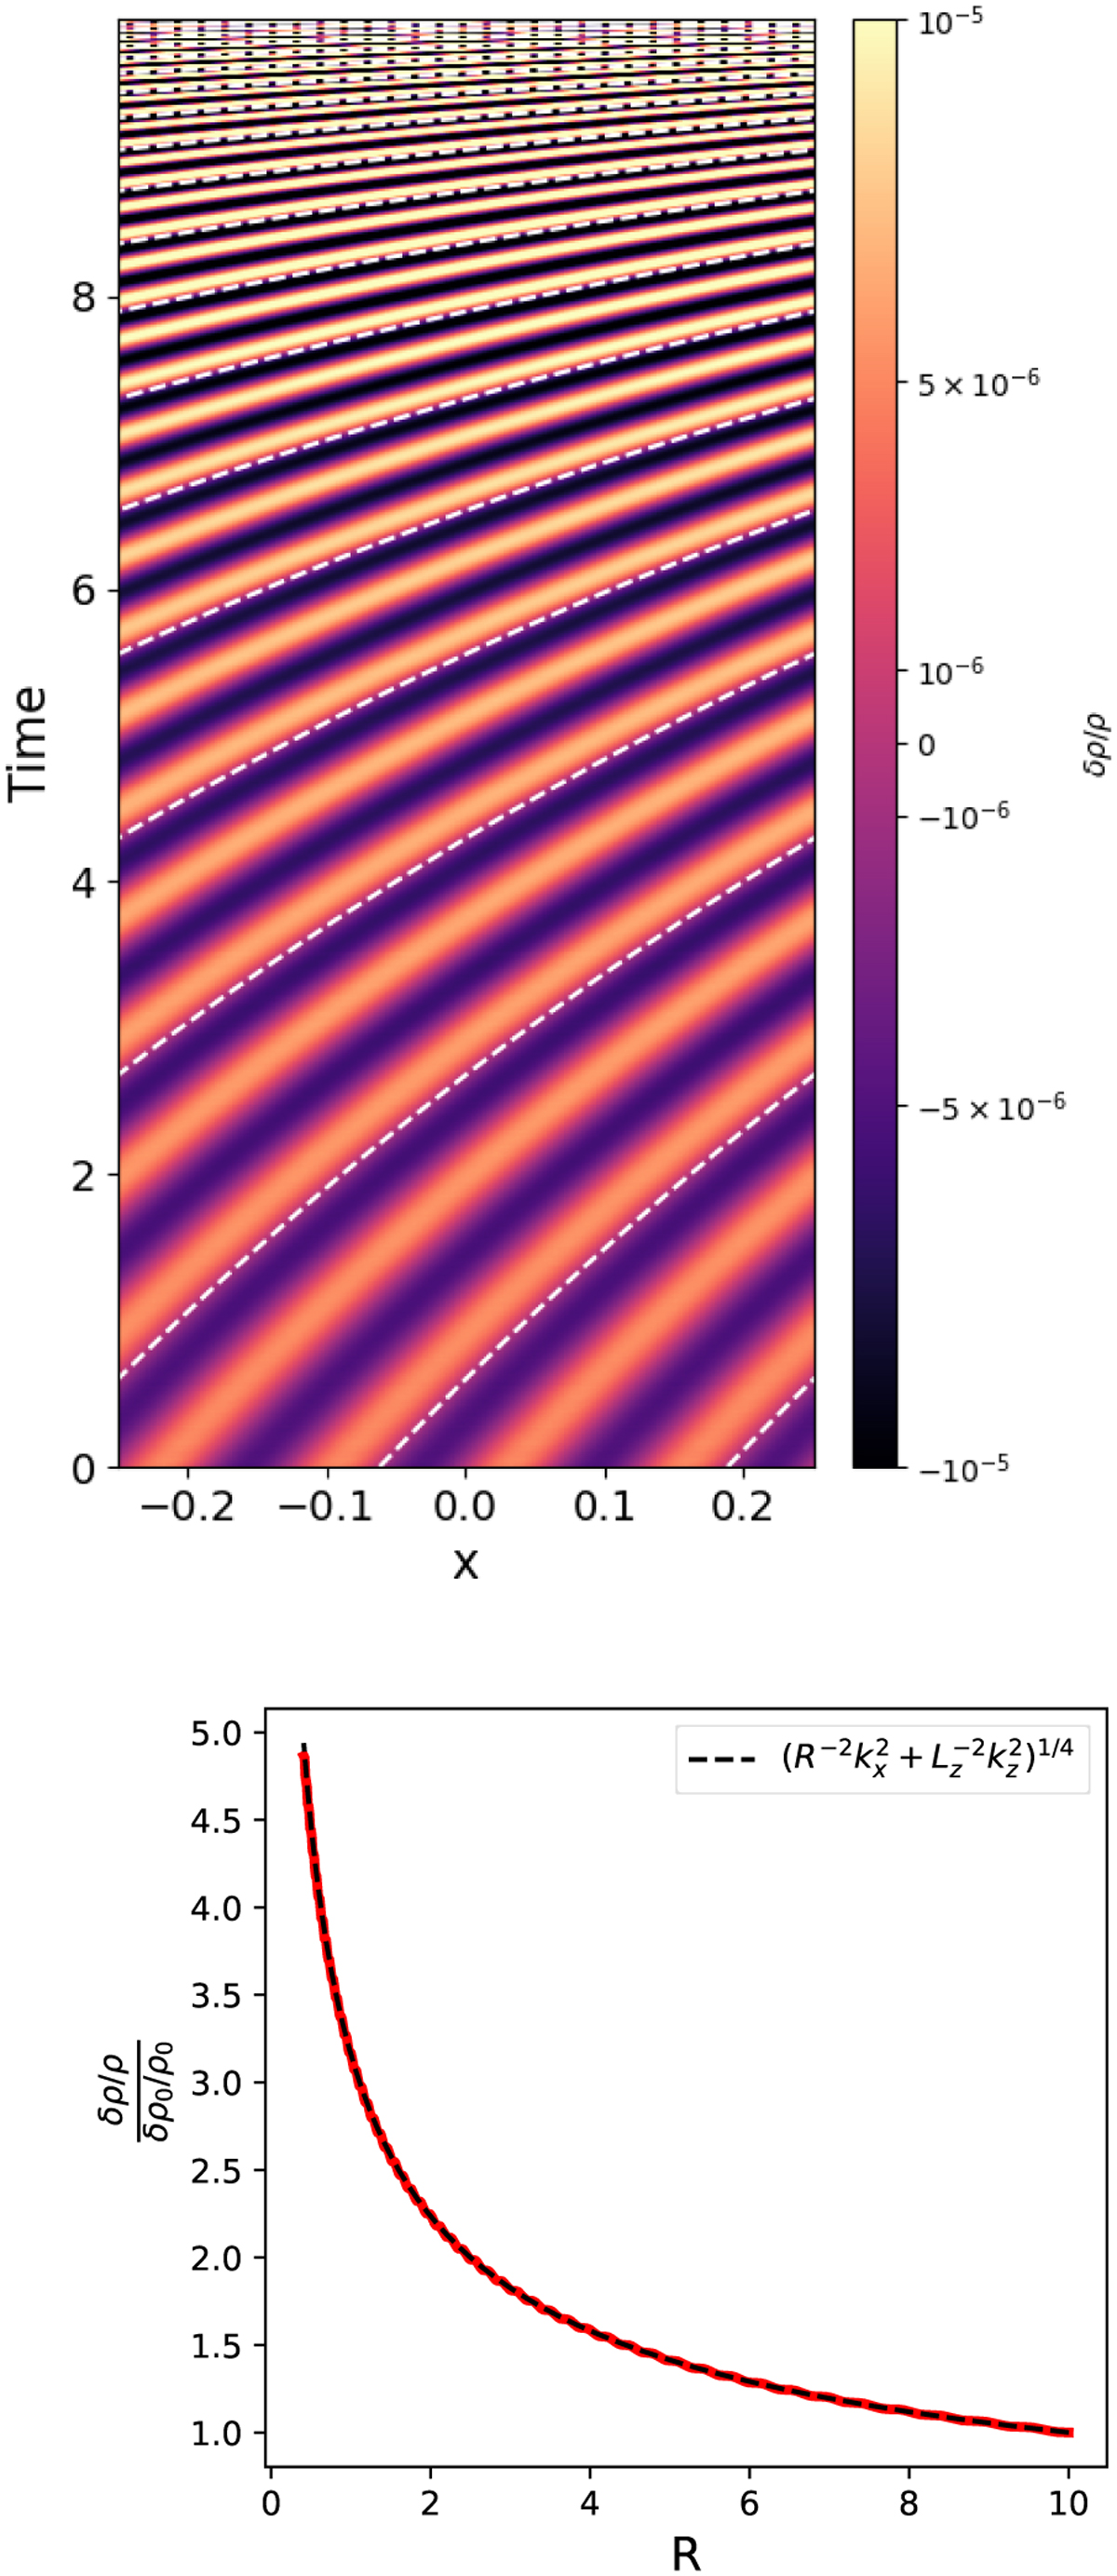
Test case of purely horizontal sound wave with uniform collapse. Upper panel: space–time plot for vertically averaged relative density variation. Dashed lines show the theoretical expectation for phase evolution, in good agreement with the numerical results. Lower panel: relative amplitude of perturbation, δρ/ρ, as a function of R from the simulation (solid red line). The wave operates under the WKB regime, and is closely consistent with the theoretical expectation from the WKB approximation solution (dashed black line). The wiggles in the simulation results are not present in the WKB solution, but are consistent with the exact solution presented in Eq. (54).
Current usage metrics show cumulative count of Article Views (full-text article views including HTML views, PDF and ePub downloads, according to the available data) and Abstracts Views on Vision4Press platform.
Data correspond to usage on the plateform after 2015. The current usage metrics is available 48-96 hours after online publication and is updated daily on week days.
Initial download of the metrics may take a while.