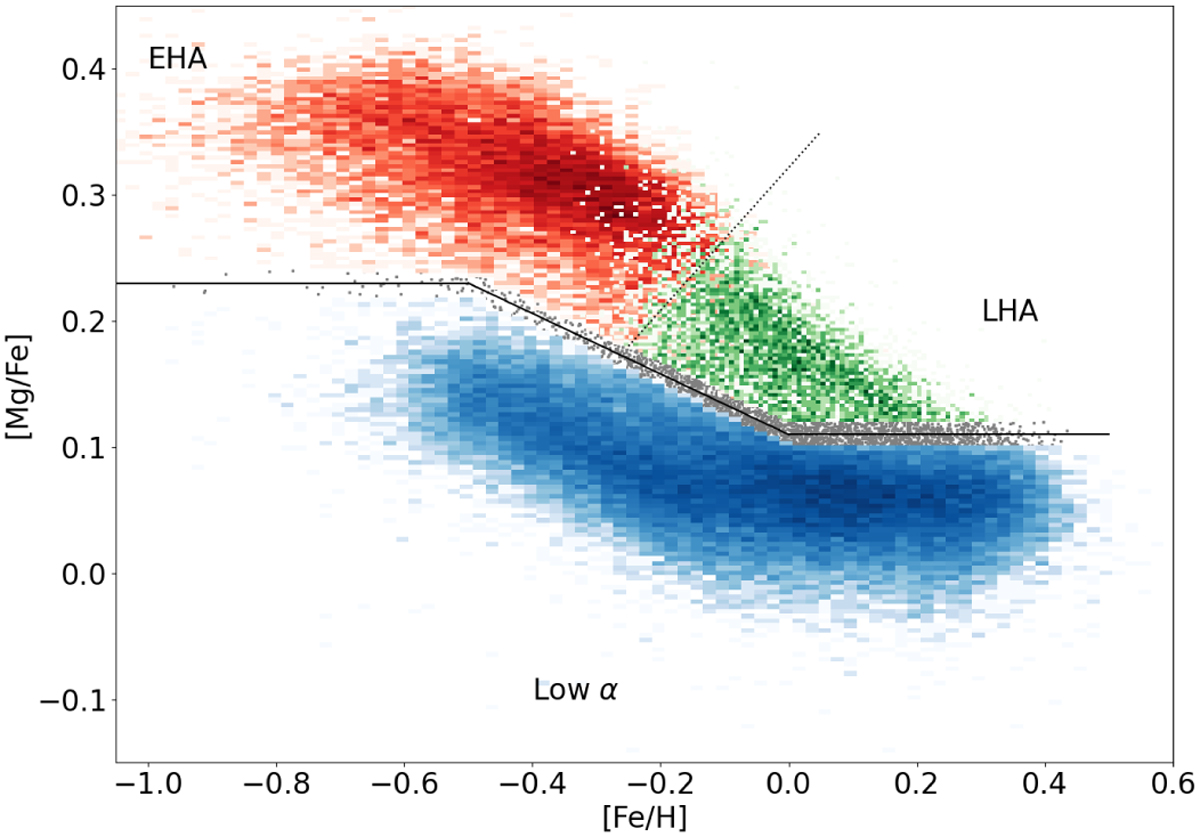
Fig. 6
Download original image
Stars from Fig. 3 in the [Mg/Fe]-[Fe/H] plane. This time the three populations are identified by colour. Blue is the low-α population, red is early high-α and green is late high-α. The grey stars are the buffer zone used to minimize contamination between the low and high-α disks. (The dotted line is a purely visual aid to show the approximate boundary of the two high-α populations.)
Current usage metrics show cumulative count of Article Views (full-text article views including HTML views, PDF and ePub downloads, according to the available data) and Abstracts Views on Vision4Press platform.
Data correspond to usage on the plateform after 2015. The current usage metrics is available 48-96 hours after online publication and is updated daily on week days.
Initial download of the metrics may take a while.