Fig. 3
Download original image
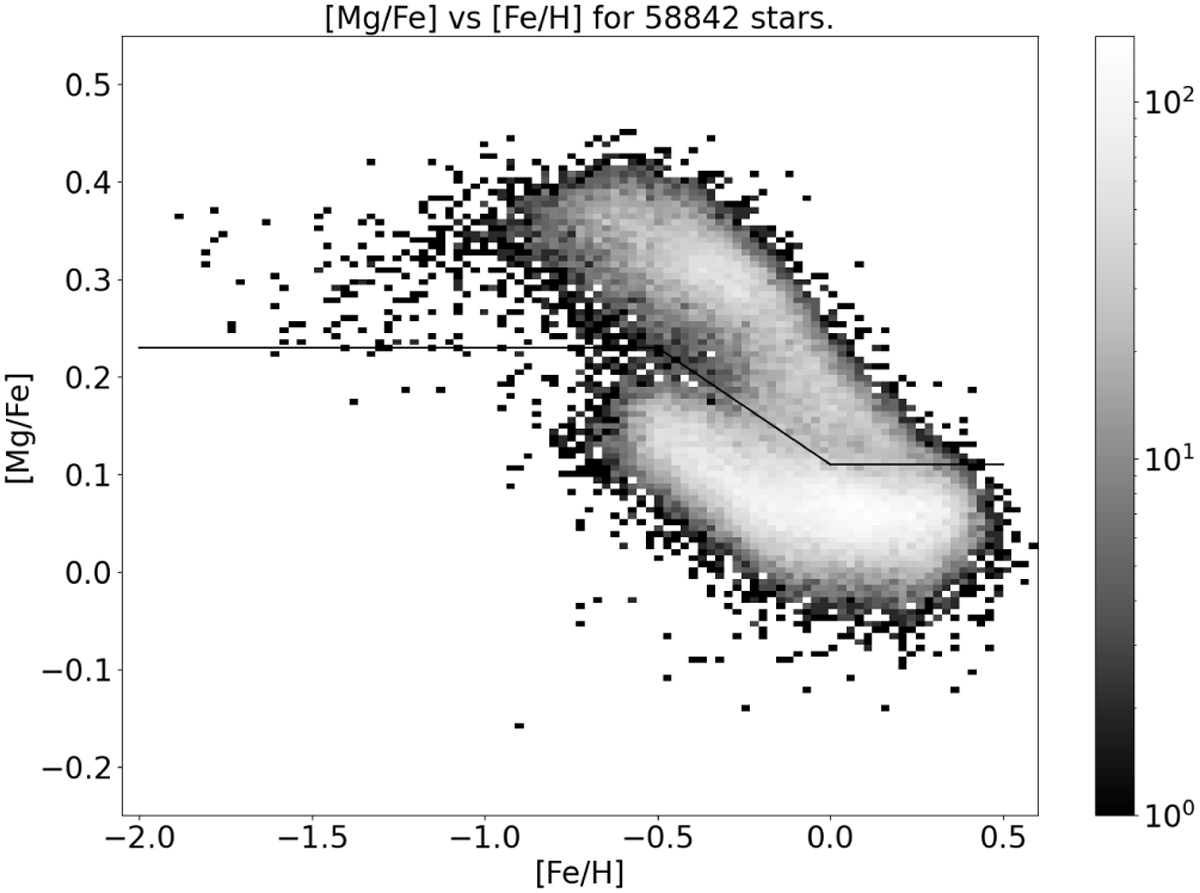
Stars in the sample plotted in the [Mg/Fe]-[Fe/H] plane. The lines show the division into high- and low-α components. A buffer zone 0.01dex either side of the lines (i.e. 0.02 dex total) was discarded from the separated samples to avoid population cross-contamination. There is faint evidence of clustering in the high-α disk which is more prominent in the [C/Fe]-[Fe/H] plane as show in Fig. 4
Current usage metrics show cumulative count of Article Views (full-text article views including HTML views, PDF and ePub downloads, according to the available data) and Abstracts Views on Vision4Press platform.
Data correspond to usage on the plateform after 2015. The current usage metrics is available 48-96 hours after online publication and is updated daily on week days.
Initial download of the metrics may take a while.