Open Access
Fig. 2
Download original image
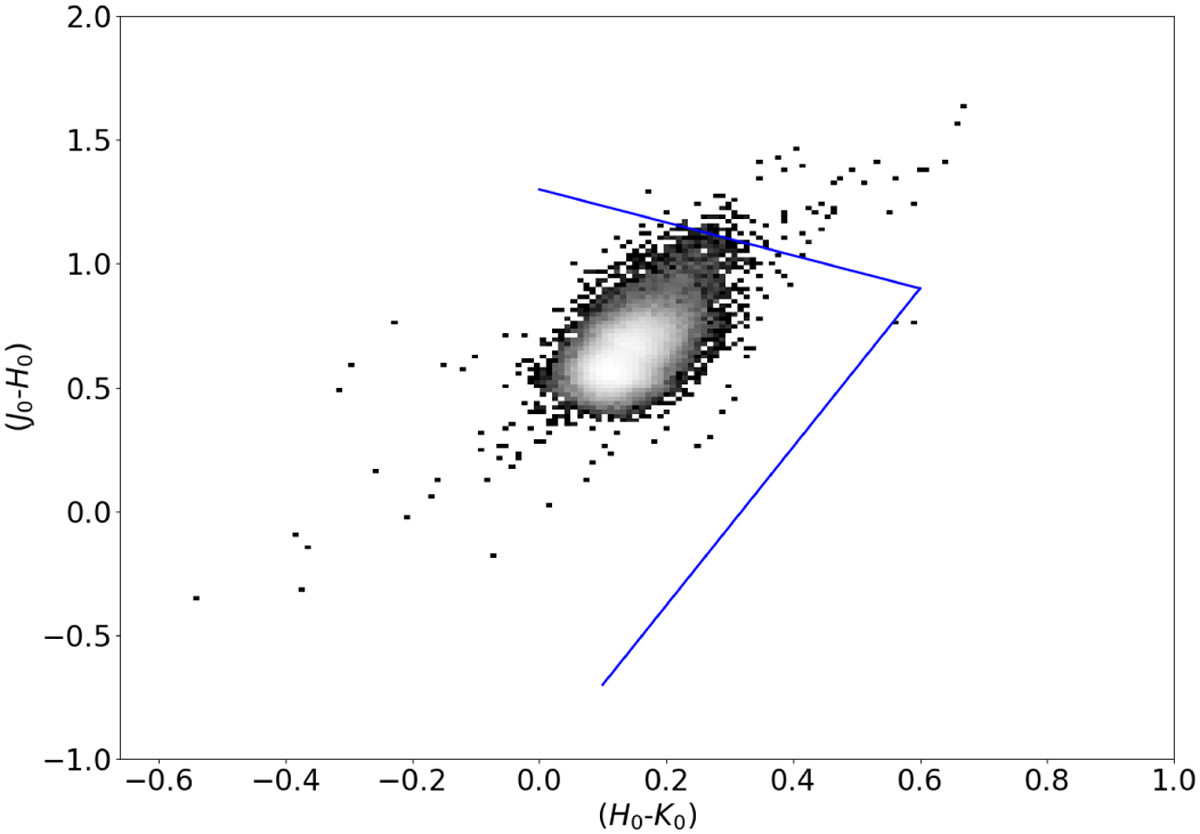
Dereddened IR colour density plot of stars in sample based on method in Schiavon et al. (2017). Stars above the upper blue line or to the right of the lower blue line are assumed to be AGB stars, YSOs or planetary nebulae and excluded from further analysis.
Current usage metrics show cumulative count of Article Views (full-text article views including HTML views, PDF and ePub downloads, according to the available data) and Abstracts Views on Vision4Press platform.
Data correspond to usage on the plateform after 2015. The current usage metrics is available 48-96 hours after online publication and is updated daily on week days.
Initial download of the metrics may take a while.