Fig. A.1
Download original image
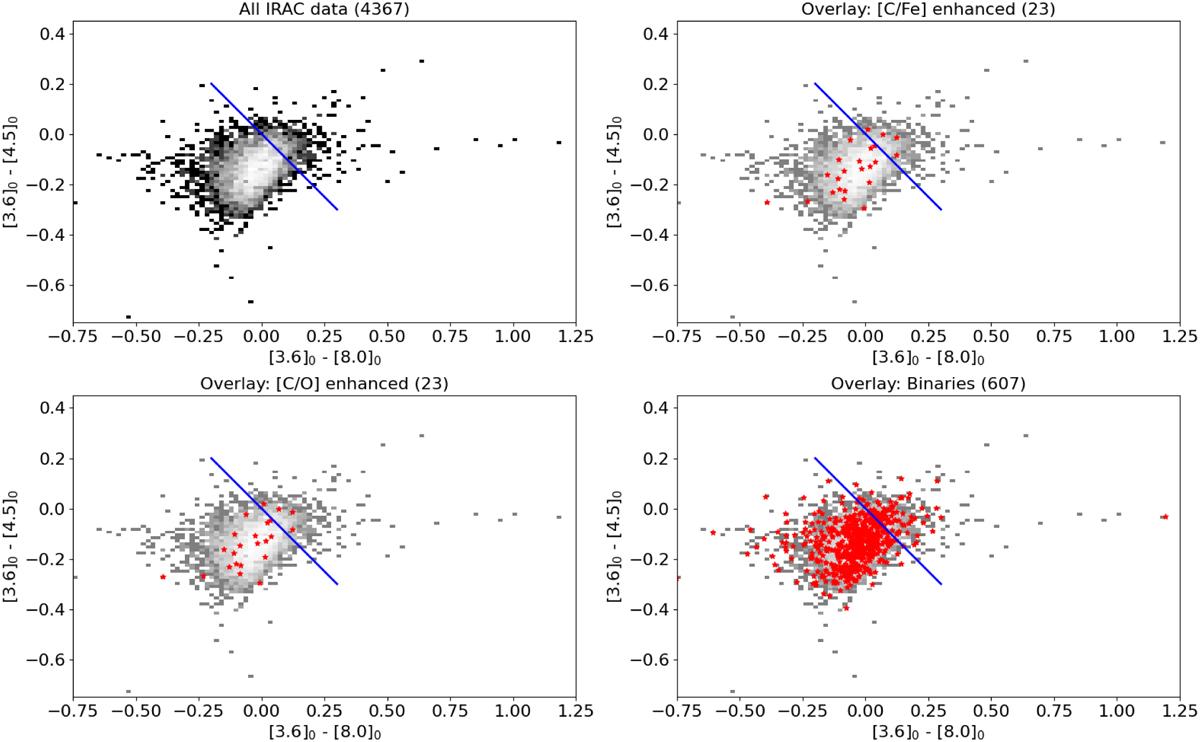
Plots of pre-filtered APOGEE DR17 stars with IRAC magnitudes available on dereddened colour excess diagrams. Upper left plot shows the base population with blue line indicating potential AGB stars to the right of the line. Lower left plot is overlaid with [C/O] enhanced stars as discussed in Sec. 3. Upper right plot is overlaid with stars having high [C/Fe] on a similar basis. Lower right plot is overlaid with binaries. In the three latter cases, the number of stars in the overlaid plots follows the split of the underlying population to within 1.1σ
Current usage metrics show cumulative count of Article Views (full-text article views including HTML views, PDF and ePub downloads, according to the available data) and Abstracts Views on Vision4Press platform.
Data correspond to usage on the plateform after 2015. The current usage metrics is available 48-96 hours after online publication and is updated daily on week days.
Initial download of the metrics may take a while.