Fig. 15
Download original image
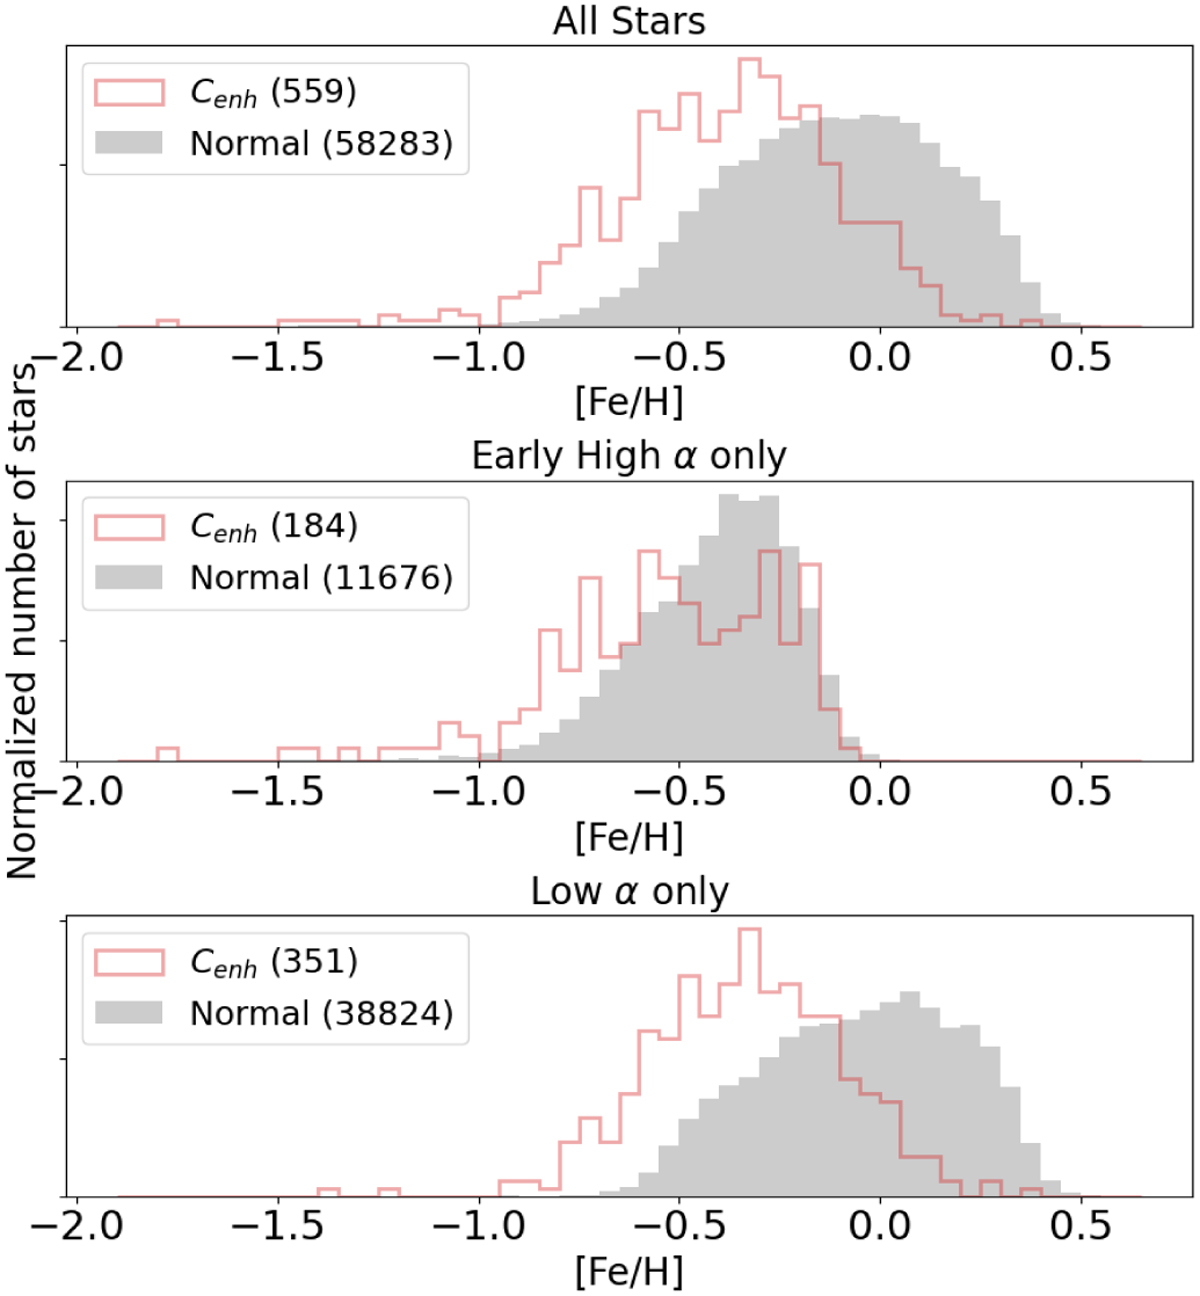
Histogram showing normalized metallicity distributions of Cenh and C-normal stars. The top panel shows all stars combined, the middle panel shows high α stars only, and the bottom panel only low α stars. The differences between means is 0.26 dex in the top panel, 0.08 dex for high α stars and 0.30 dex for low α stars. No histogram for late high α stars is shown due to the small number of Cenh stars in this subpopulation.
Current usage metrics show cumulative count of Article Views (full-text article views including HTML views, PDF and ePub downloads, according to the available data) and Abstracts Views on Vision4Press platform.
Data correspond to usage on the plateform after 2015. The current usage metrics is available 48-96 hours after online publication and is updated daily on week days.
Initial download of the metrics may take a while.