Fig. 14
Download original image
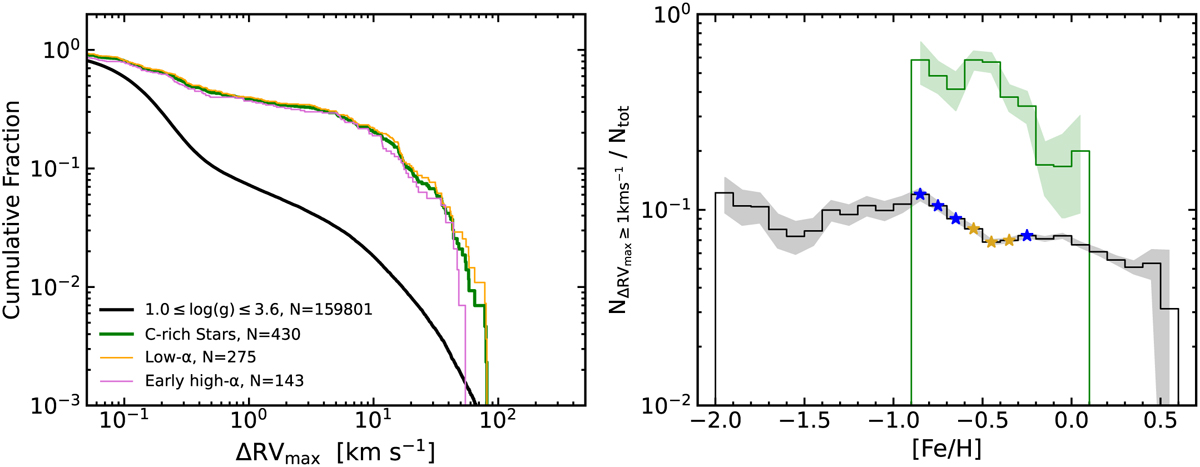
Left panel: cumulative fraction histogram of ΔRVmax for the Cenh stars (green), log g-controlled comparison sample from APOGEE DR17 (black), and the low-α (orange) and early high-α (pink) sub-samples. The Cenh stars are skewed towards larger ΔRVmax values compared to the control sample. Right panel: RV variability fraction as a function of metallicity for the Cenh (green) and control sample (black). Uncertainties on the RV variability fractions are shown as the shading, and bins where there is a difference of between 2σ and 5σ in RV variability are marked with blue and golden stars, respectively. Both samples demonstrate an anti-correlation with metallicity, but the Cenh stars have consistently larger fractions than the control sample.
Current usage metrics show cumulative count of Article Views (full-text article views including HTML views, PDF and ePub downloads, according to the available data) and Abstracts Views on Vision4Press platform.
Data correspond to usage on the plateform after 2015. The current usage metrics is available 48-96 hours after online publication and is updated daily on week days.
Initial download of the metrics may take a while.