Fig. 12
Download original image
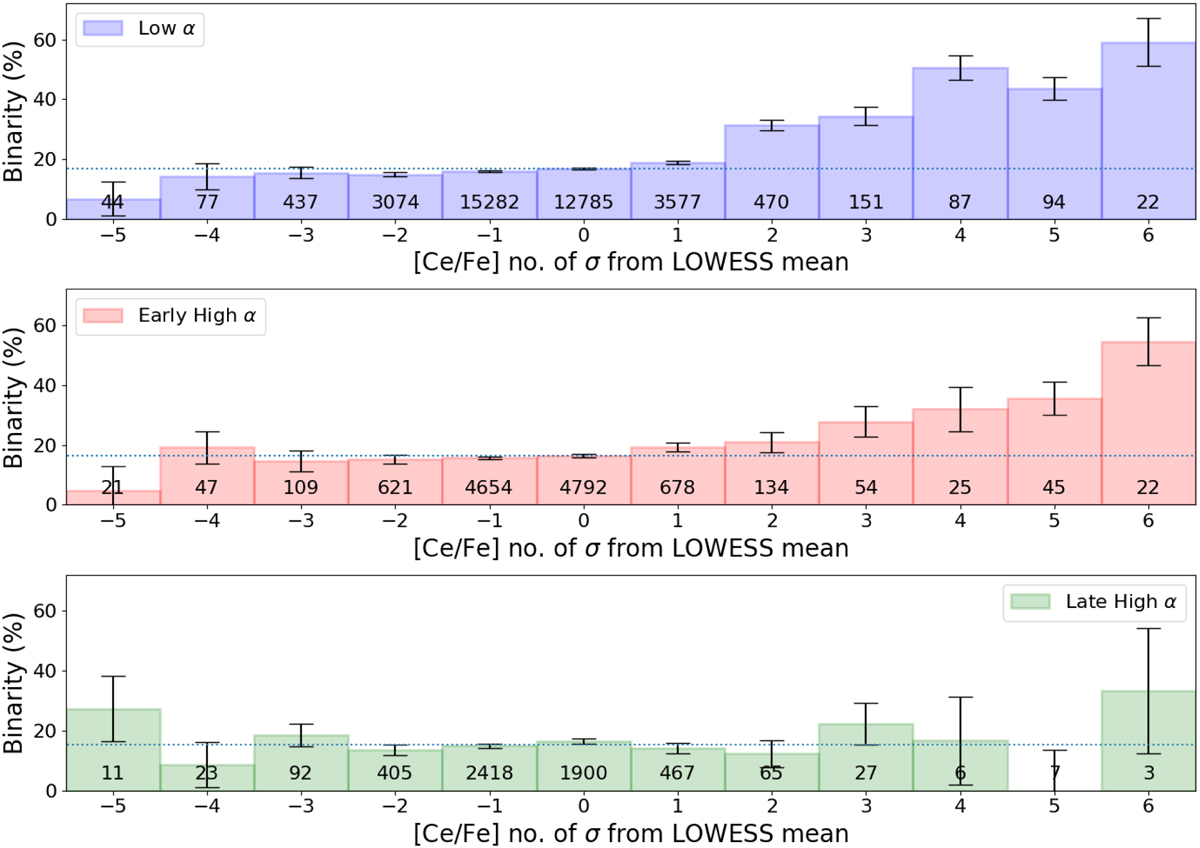
Percentage of stars are binary against number of standard deviations of [Ce/Fe] abundance for stars from the same population and similar [Fe/H]. The panels show the low early high α and late high α populations. Error bars are based on binomial distribution of overall population binarity. The dotted line represents the binarity fraction for the whole of each population.
Current usage metrics show cumulative count of Article Views (full-text article views including HTML views, PDF and ePub downloads, according to the available data) and Abstracts Views on Vision4Press platform.
Data correspond to usage on the plateform after 2015. The current usage metrics is available 48-96 hours after online publication and is updated daily on week days.
Initial download of the metrics may take a while.