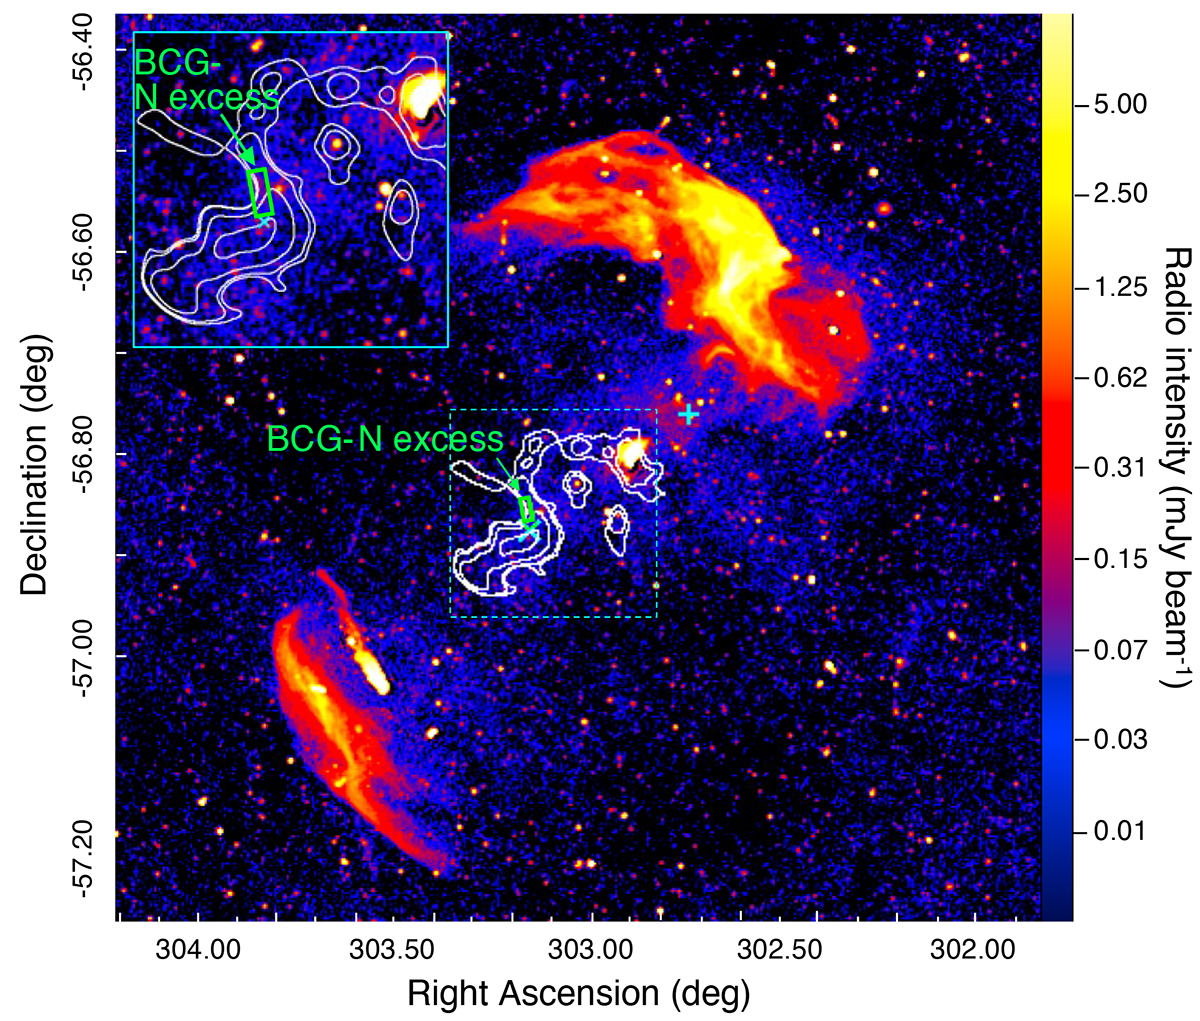
Fig. 9.
Download original image
Radio total intensity map with the ASKAP. Cyan crosses indicate the locations of the first BCG and the second BCG, individually. The white contours are the same as the black ones in Fig. 3. The inset panel shows the enlarged image of the dotted cyan rectangle region. The cyan rectangle indicates the radio intensity excess region in the BCG-N tail.
Current usage metrics show cumulative count of Article Views (full-text article views including HTML views, PDF and ePub downloads, according to the available data) and Abstracts Views on Vision4Press platform.
Data correspond to usage on the plateform after 2015. The current usage metrics is available 48-96 hours after online publication and is updated daily on week days.
Initial download of the metrics may take a while.