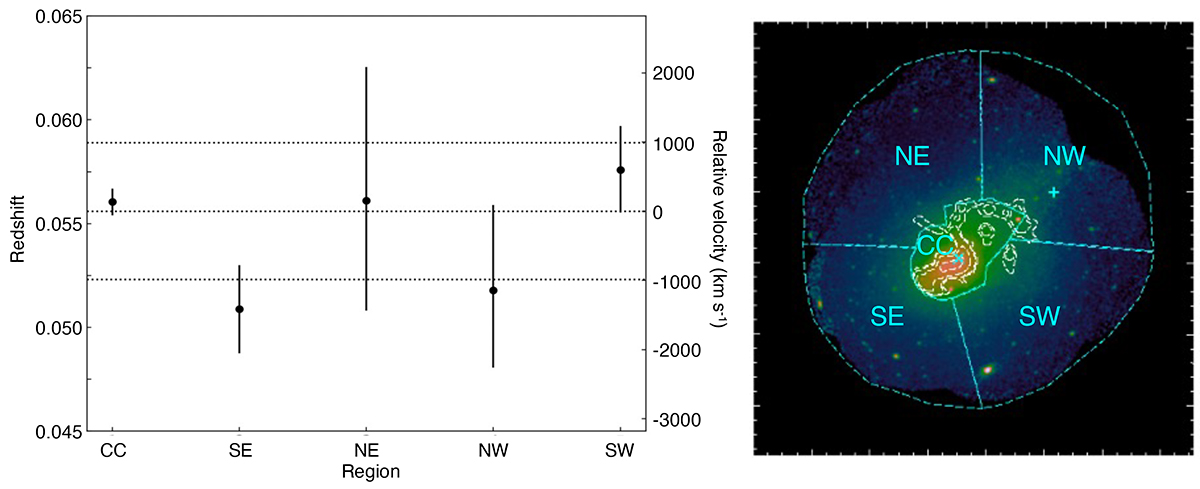
Fig. 7.
Download original image
Redshift measurements in the large regions. The region we define is overlaid on the right panel, which is the same image as in Fig. 1. The horizontal axis is the region number given in the right panel of Fig. 8. The right-hand scale in the redshift distribution is the relative velocity based on the optical redshift of the first BCG (z = 0.0556). As a guide, the velocity differences of ±1000 km s−1 are shown as the two dotted lines.
Current usage metrics show cumulative count of Article Views (full-text article views including HTML views, PDF and ePub downloads, according to the available data) and Abstracts Views on Vision4Press platform.
Data correspond to usage on the plateform after 2015. The current usage metrics is available 48-96 hours after online publication and is updated daily on week days.
Initial download of the metrics may take a while.