Fig. 4.
Download original image
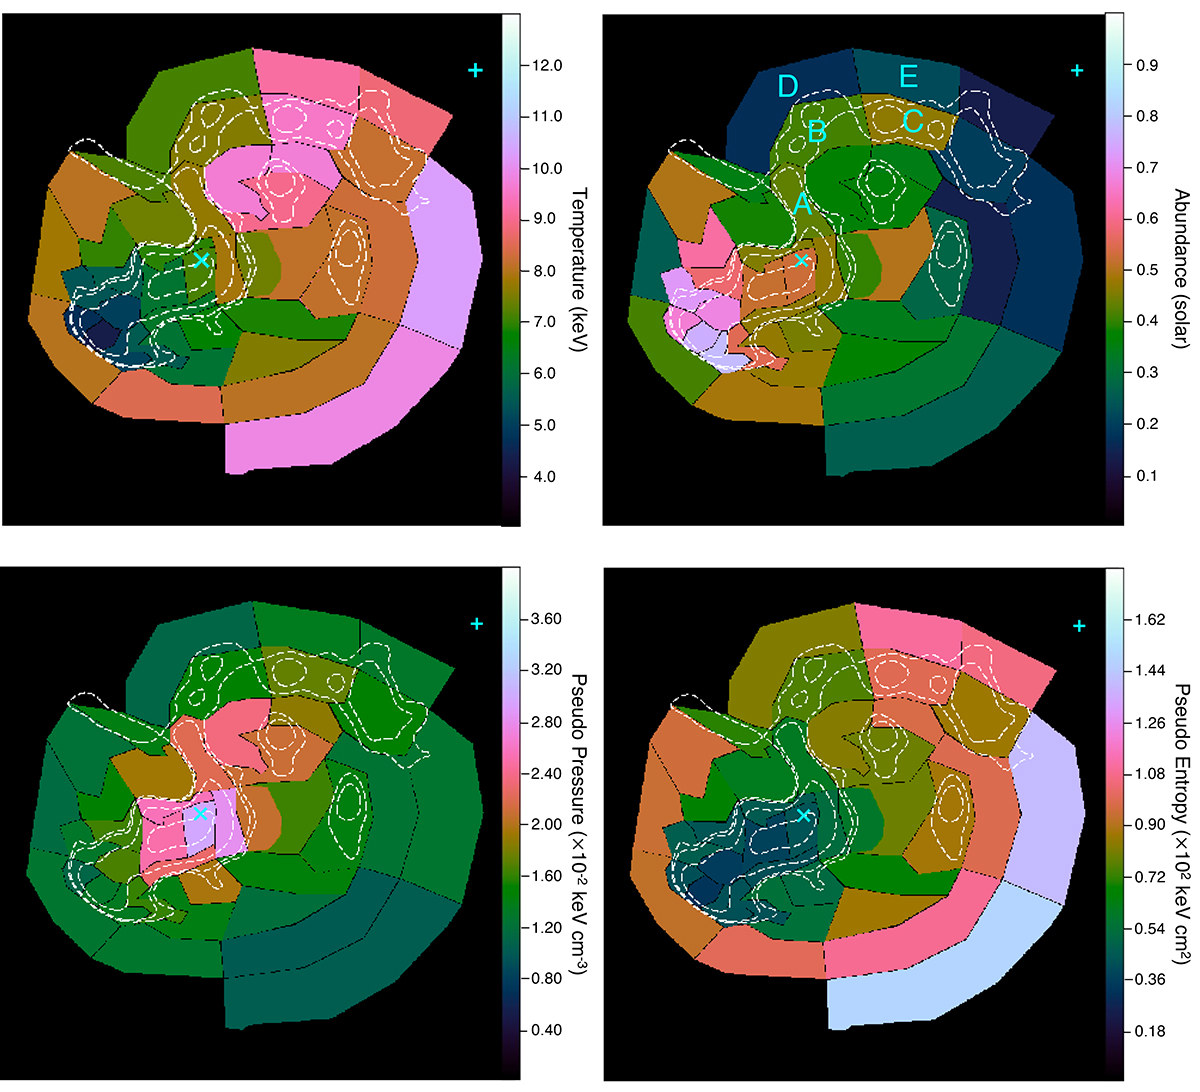
Thermodynamic and abundance maps with regions as indicated by the red polygons in the right panel of Fig. 3. The upper-left panel shows a temperature map overlaid with white contours that are the same as the black contours in the left panel of Fig. 3. The pseudo-density (upper right), pseudo-pressure (lower left), and pseudo-entropy (lower right) maps assume that the ICM is uniformly spread over the line-of-sight depth of 1 Mpc. The units of the 2D temperature, pseudo-density, pseudo-pressure, and pseudo-entropy maps are keV, cm−3 × (l/1 Mpc)−1/2, keV cm−3 × (l/1 Mpc)−1/2, and keV cm2 × (l/1 Mpc)1/3, respectively. The cyan symbols (“x” and “+”) represent the BCGs, as in Fig. 1.
Current usage metrics show cumulative count of Article Views (full-text article views including HTML views, PDF and ePub downloads, according to the available data) and Abstracts Views on Vision4Press platform.
Data correspond to usage on the plateform after 2015. The current usage metrics is available 48-96 hours after online publication and is updated daily on week days.
Initial download of the metrics may take a while.